
Broker Globale Piattaforma di Verifica Regolamentare
WikiFX
English
简体中文
繁體中文
English
Pусский
日本語
ภาษาไทย
Tiếng Việt
Bahasa Indonesia
Español
हिन्दी
Filippiiniläinen
Français
Deutsch
Português
Türkçe
한국어
العربية
FPG EURUSD Market Report March 30, 2026
Sommario:On the H1 timeframe chart, EURUSD showed a strong bullish rally at the beginning of last week, surging from 1.1483 to 1.1639. However, it failed to sustain the upward momentum from that peak, leading
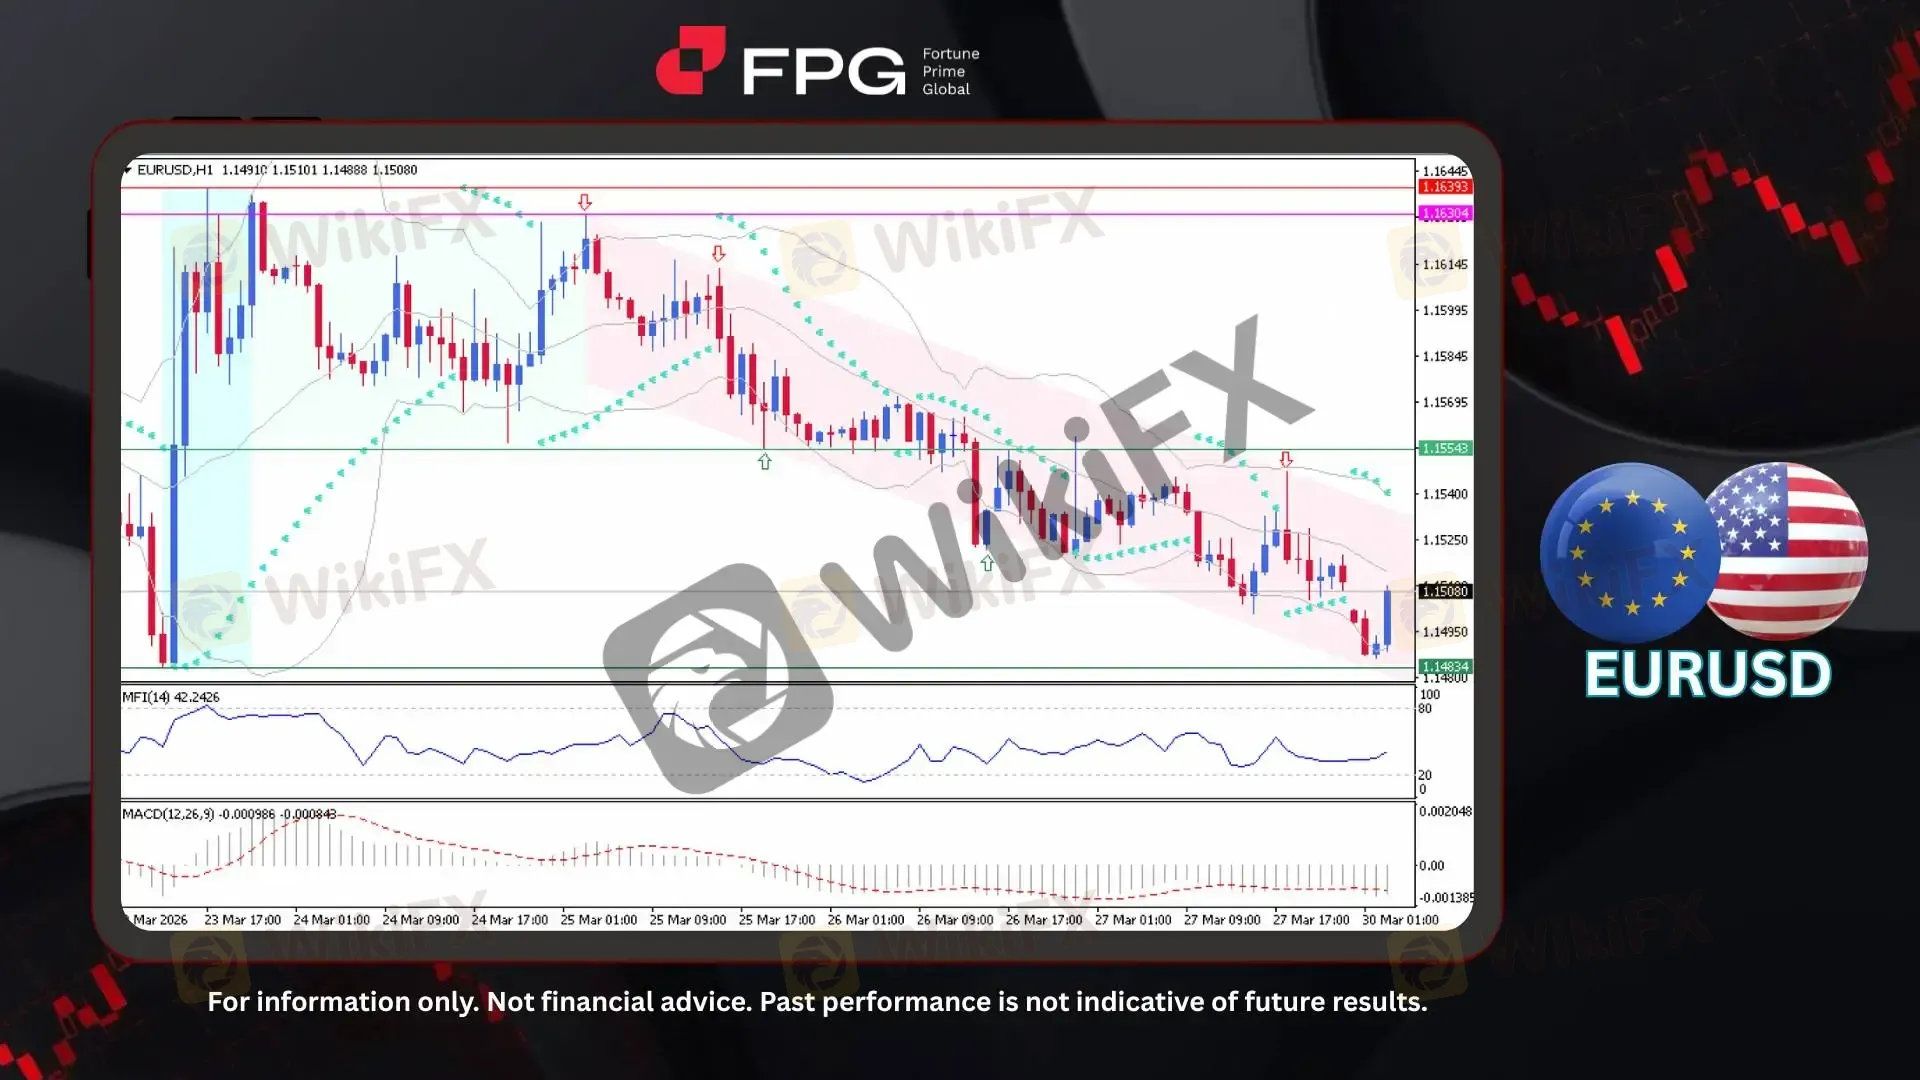
On the H1 timeframe chart, EURUSD showed a strong bullish rally at the beginning of last week, surging from 1.1483 to 1.1639. However, it failed to sustain the upward momentum from that peak, leading to a trend reversal into a consistent and prolonged bearish trend, forming a well-defined descending channel. The price briefly broke below the lower boundary of the channel but quickly moved back inside. This bearish move started from around 1.1630, and the current price stands at 1.1508, still trading within the descending channel.
From a technical perspective, the bearish bias remains dominant. The Bollinger Bands indicate that price is consistently hugging the lower band, reflecting sustained downside pressure and limited bullish momentum. The Parabolic SAR dots are positioned above the candles, reinforcing the ongoing downtrend structure. Meanwhile, the MFI (Money Flow Index) is hovering in the mid-to-lower range, suggesting weak buying interest without clear oversold reversal signals. The MACD remains below the zero line with a relatively flat histogram, indicating bearish momentum is still present, although slightly weakening, which may open the door for short-term consolidation rather than immediate reversal.
Recent economic data across the US, UK, and Eurozone indicate slowing growth alongside persistent inflation pressures, largely driven by elevated energy prices and tighter financial conditions. The US shows relatively resilient yet strained conditions, while the UK faces weakening consumption and rising recession risks, and the Eurozone is approaching stagnation with increasing stagflation concerns. This divergence supports USD strength and adds downside pressure on EURUSD, so traders should remain alert to todays key economic releases.
Technical Market Overview
1. Current Position: EURUSD is trading around 1.1508, maintaining a bearish structure within a well-defined descending channel following the recent reversal from the 1.1639 peak.
2. Resistance Zone: Immediate resistance is located at 1.1554, aligning with the mid-channel area. A stronger resistance level is seen at 1.1630–1.1639, marking the previous swing high and key supply zone.
3. Support Zone: Nearest support is positioned at 1.1483–1.1493, which represents the recent low and lower boundary of the descending channel. A break below this area could open further downside potential.
4. Indicator Observation: Bollinger Bands show price moving near the lower band, indicating sustained bearish pressure. Parabolic SAR remains above the candles, confirming the downtrend. MFI is in the mid-to-lower range, reflecting weak buying interest, while MACD stays below the zero line, suggesting ongoing bearish momentum with slight signs of slowing.
5. Technical Summary: The overall bias remains bearish as price continues to respect the descending channel structure. While momentum shows signs of mild exhaustion, no clear reversal signal has formed yet. Short-term consolidation or minor pullback is possible, but downside pressure is likely to persist unless price breaks above key resistance levels.
Market Performance:
Forex Last Price % Change
USD/JPY 159.95 −0.18%
GBP/USD 1.3257 +0.05%
Today's Key Economic Calendar:
JP: BoJ Summary of Opinions
JP: Housing Starts YoY
UK: BoE Consumer Credit
UK: Mortgage Approvals & Lending
EU: Economic Sentiment
DE: Inflation Rate MoM & YoY Preliminary
US: Dallas Fed Manufacturing Index
US: Fed Chair Powell Speech
Risk Disclaimer: This report is for informational purposes only and does not constitute financial advice. Investments involve risks, and past performance does not guarantee future results. Consult your financial advisor for personalized investment strategies.
Disclaimer:
Le opinioni di questo articolo rappresentano solo le opinioni personali dell’autore e non costituiscono consulenza in materia di investimenti per questa piattaforma. La piattaforma non garantisce l’accuratezza, la completezza e la tempestività delle informazioni relative all’articolo, né è responsabile delle perdite causate dall’uso o dall’affidamento delle informazioni relative all’articolo.
WikiFX Trader
FXCM
Sotto supervisione
FOREX.com
Supervisione del paese
IC Markets Global
Sotto supervisione
GTCFX
Sotto supervisione
vantage
Sotto supervisione
ZFX
Sotto supervisione
FXCM
Sotto supervisione
FOREX.com
Supervisione del paese
IC Markets Global
Sotto supervisione
GTCFX
Sotto supervisione
vantage
Sotto supervisione
ZFX
Sotto supervisione
Rate Calc
USD

CNY
Tasso di cambio attuale:0
inserisci l'importo
USD
A disposizione
CNY
Calcolare 