
Applicazione di richiesta di informazioni sulla regolamentazione dei broker globali
WikiFX
English
简体中文
繁體中文
English
Pусский
日本語
ภาษาไทย
Tiếng Việt
Bahasa Indonesia
Español
हिन्दी
Filippiiniläinen
Français
Deutsch
Português
Türkçe
한국어
العربية
FPG USDJPY Market Report February 20, 2026
Sommario:On the H1 chart, USDJPY initially traded within a sideways channel in the 152.56–153.74 range, with 152.56 serving as support and 153.74 as resistance, reflecting a balanced market structure. After th
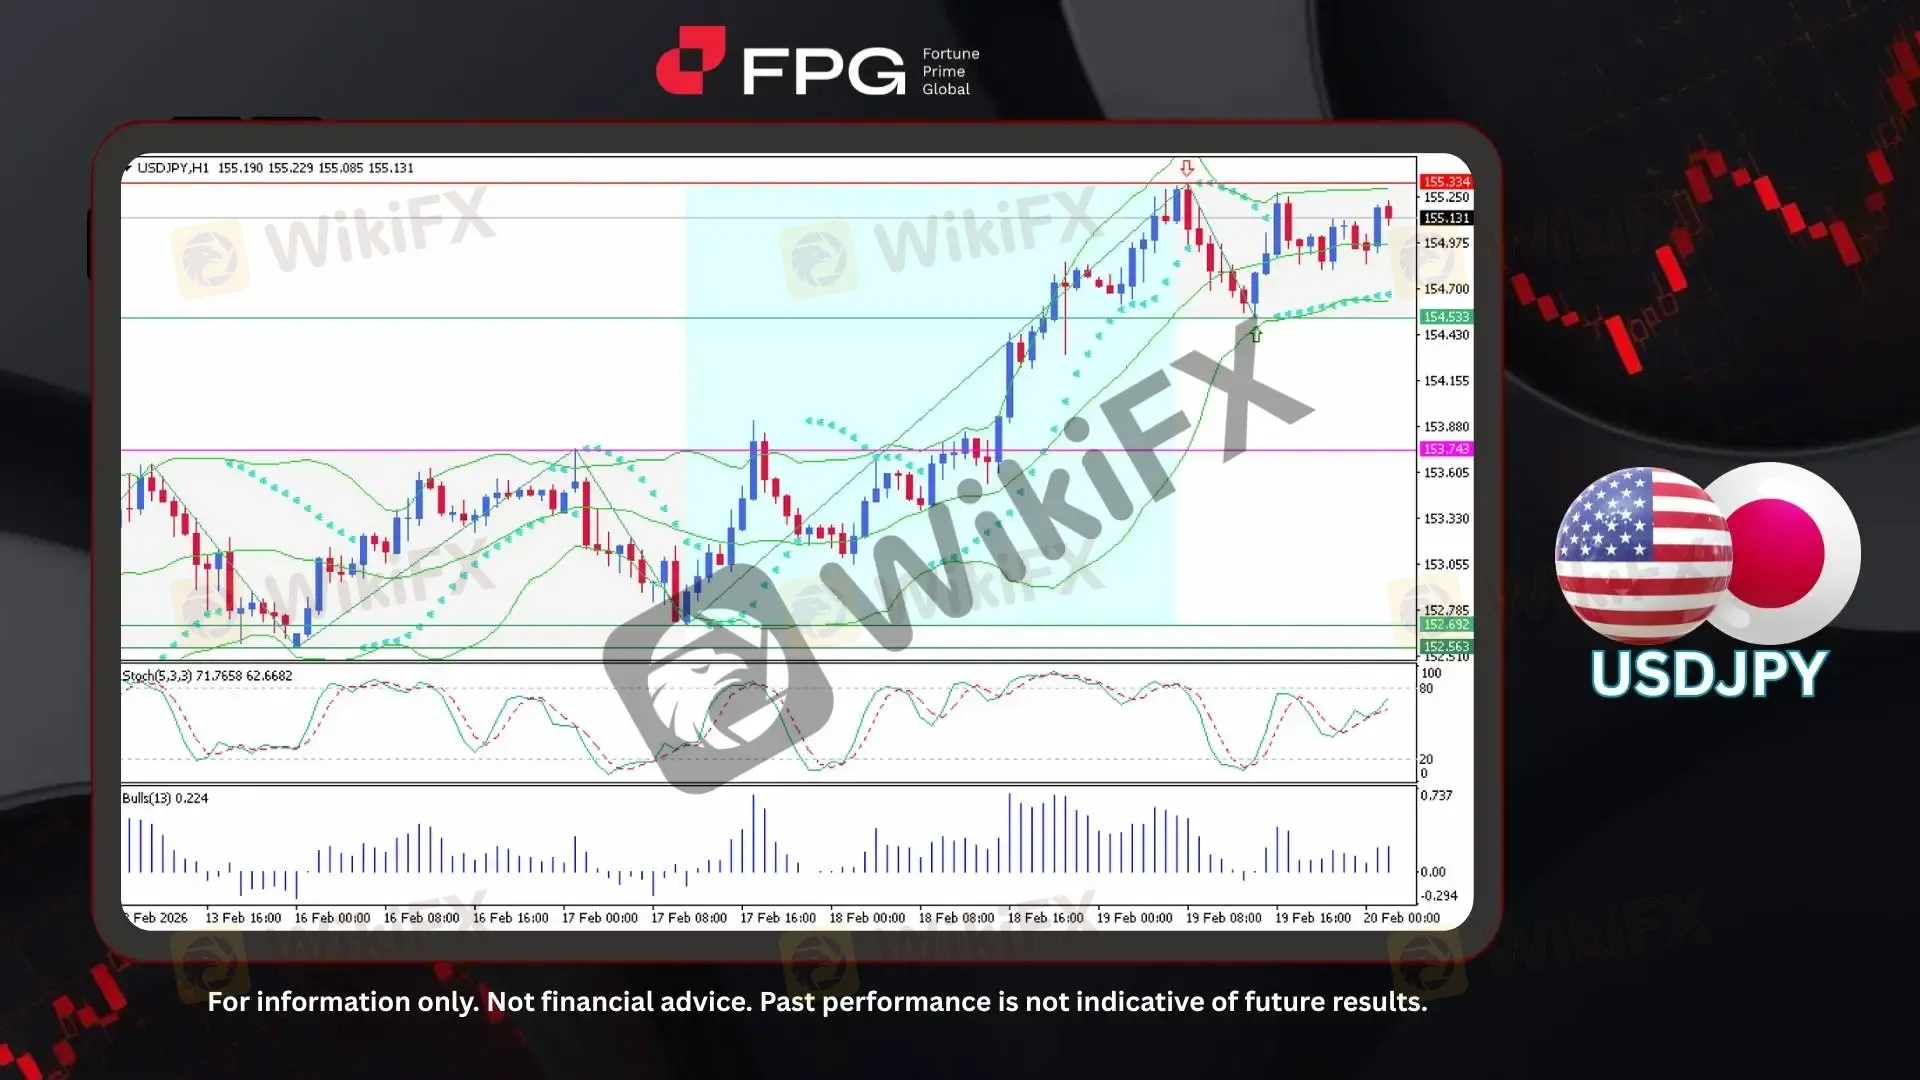
On the H1 chart, USDJPY initially traded within a sideways channel in the 152.56–153.74 range, with 152.56 serving as support and 153.74 as resistance, reflecting a balanced market structure. After this consolidation phase, a bullish rally emerged from around 152.69, as price rebounded near the lower boundary and decisively broke above the channel resistance, confirming strong upward momentum. The rally extended aggressively and eventually peaked near 155.33, marking the completion of the bullish impulse. Following this advance, price transitioned into another consolidation phase, currently fluctuating between approximately 154.53 and 155.33, forming a higher-level sideways structure after the strong bullish expansion.
From a technical indicator perspective, price remains supported above the midline of the Bollinger Bands, with the upper band previously expanding during the rally phase — a sign of strong volatility expansion. The Parabolic SAR dots have shifted below price again after the recent pullback, indicating a short-term bullish bias. Meanwhile, the Stochastic oscillator has rebounded from the oversold area and is now pointing upward, suggesting recovering momentum, although it has not yet reached extreme overbought territory. This combination reflects consolidation with a mild bullish inclination rather than a confirmed reversal.
USDJPY strengthened toward the intraday resistance area after the latest U.S. jobless claims came in lower than expected, reinforcing the dollar and pushing the 10-year U.S. Treasury yield higher. On the Japanese side, the yen remained under pressure after Japans latest Inflation Rate held steady, signaling limited immediate policy urgency and allowing the pair to maintain its bullish momentum.
Market Observation & Strategy Advice
1. Current Position: USDJPY is trading around 155.13, consolidating after a strong bullish rally from 152.69 and maintaining a higher-level structure.
2. Resistance Zone: Immediate resistance stands at 155.33, the recent swing high and bullish peak.
3. Support Zone: Nearest support is at 154.53, followed by stronger structural support at 153.74.
4. Indicator Observation: Bollinger Bands show post-rally consolidation, Parabolic SAR remains below price signaling short-term bullish bias, and Stochastic is turning upward, indicating recovering momentum without extreme overbought conditions.
5. Trading Strategy Suggestions:
Bullish Bias: Bullish bias remains intact as long as price holds above 154.53.
Breakout Scenario: Break above 155.33 may trigger bullish continuation setups.
Pullback Scenario: Rejection near 155.33 could open short-term pullback opportunities toward 154.53.
Market Performance:
Forex Last Price % Change
EUR/USD 1.1770 −0.02%
GBP/USD 1.3461 −0.01%
Todays Key Economic Calendar:
US: EIA Crude Oil & Gasoline Stocks Change
AU: S&P Global Manufacturing & Services PMI Flash
JP: Inflation Rate YoY
JP: S&P Global Manufacturing & Services PMI Flash
CN: Loan Prime Rate 1Y & 5Y
DE: PPI YoY
UK: Retail Sales MoM & YoY
EU: HCOB Composite, Manufacturing, & Services PMI Flash
UK: S&P Global Manufacturing & Services PMI Flash
EU: Negotiated Wage Growth
US: Core PCE Price Index MoM
US: GDP Growth Rate & Price Index QoQ Adv
US: PCE Price Index MoM & YoY
US: Personal Income & Spending MoM
US: Fed Bostic Speech
US: S&P Composite, Manufacturing, & Services PMI Flash
US: Michigan Consumer Sentiment Preliminary
US: New Home Sales
Risk Disclaimer: This report is for informational purposes only and does not constitute financial advice. Investments involve risks, and past performance does not guarantee future results. Consult your financial advisor for personalized investment strategies.
Disclaimer:
Le opinioni di questo articolo rappresentano solo le opinioni personali dell’autore e non costituiscono consulenza in materia di investimenti per questa piattaforma. La piattaforma non garantisce l’accuratezza, la completezza e la tempestività delle informazioni relative all’articolo, né è responsabile delle perdite causate dall’uso o dall’affidamento delle informazioni relative all’articolo.
WikiFX Trader
ZFX
Reclami dei clienti
STARTRADER
Sotto supervisione
AVATRADE
Sotto supervisione
Vantage
Sotto supervisione
GO Markets
Sotto supervisione
TMGM
Sotto supervisione
ZFX
Reclami dei clienti
STARTRADER
Sotto supervisione
AVATRADE
Sotto supervisione
Vantage
Sotto supervisione
GO Markets
Sotto supervisione
TMGM
Sotto supervisione
Rate Calc
USD

CNY
Tasso di cambio attuale:0
inserisci l'importo
USD
A disposizione
CNY
Calcolare 