

Broker Globale Piattaforma di Verifica Regolamentare
WikiFX
Italiano
简体中文
繁體中文
English
Pусский
日本語
ภาษาไทย
Tiếng Việt
Bahasa Indonesia
Español
हिन्दी
Filippiiniläinen
Français
Deutsch
Português
Türkçe
한국어
العربية
اردو
FPG USOUSD Market Report June 24, 2026
Sommario:On the M30 timeframe chart, USOUSD is currently exhibiting relatively stable price action within a defined sideways channel between 73.11 and 74.69. Price previously declined sharply from the 78.61 re
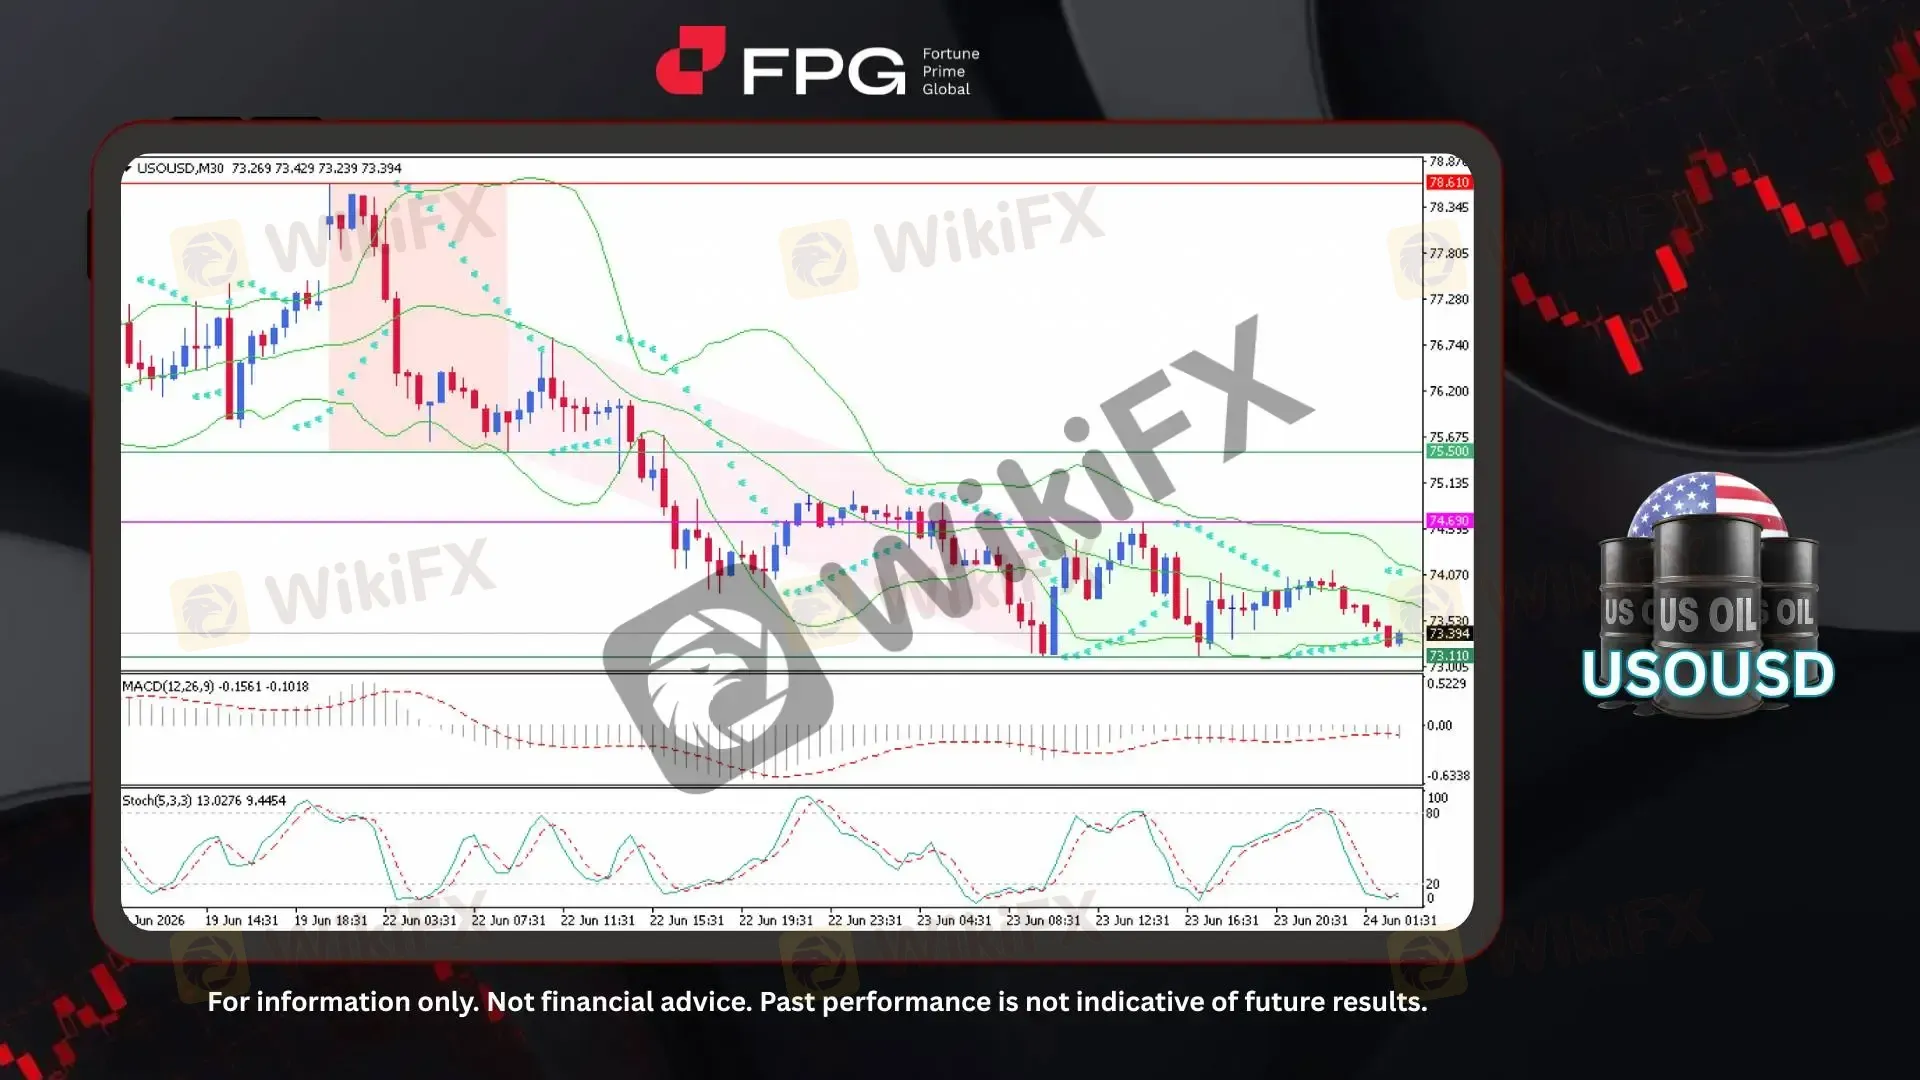
On the M30 timeframe chart, USOUSD is currently exhibiting relatively stable price action within a defined sideways channel between 73.11 and 74.69. Price previously declined sharply from the 78.61 resistance area toward 75.50, followed by continued bearish extension toward the 73.11 support zone. The latest price is trading around 73.39, with volatility remaining moderate as the market consolidates following the prior downside expansion. Overall price structure reflects a transitional phase, where the market is pausing after a sustained bearish impulse and temporarily stabilizing within a well-defined range.
Technical indicators continue to reflect residual bearish bias, although downside momentum appears to be gradually stabilizing. The SAR dots remain positioned above price action, indicating that the short-term trend structure is still under bearish control. At the same time, the Bollinger Bands have contracted compared to their previous expansion phase, signaling declining volatility and a potential continuation of range-bound conditions. The MACD remains in negative territory, while the Stochastic oscillator is approaching oversold levels, suggesting diminishing selling pressure and a possible short-term equilibrium near current support.
Global oil market sentiment remains shaped by evolving supply-side dynamics, including expectations of higher production output, easing geopolitical risk premiums, and concerns regarding potential future supply surpluses. Recent developments related to production normalization, inventory fluctuations, and improving supply flows have contributed to a broadly mixed fundamental backdrop, limiting sustained directional momentum in crude pricing. Meanwhile, persistent demand uncertainty and cautious global growth expectations continue to cap upside interest despite intermittent support from tighter physical market conditions. These combined factors have kept USOUSD in a relatively stable consolidation phase, as the market reassesses the medium-term balance between supply expansion and demand resilience.
Technical Market Overview
1. Current Position: USOUSD is currently trading around 73.39, moving within a sideways consolidation range after a prior bearish decline from 78.61. The market is now stabilizing, with price action showing limited directional momentum.
2. Resistance Zone: Immediate resistance is located at 74.69, marking the upper boundary of the current consolidation range. A break above this level may open the path toward 75.50 as the next resistance area.
3. Support Zone: Key support is seen at 73.11, acting as the lower boundary of the current range. A break below this level could trigger renewed bearish continuation.
4. Indicator Observation: SAR remains above price, indicating the short-term trend is still under bearish control. Bollinger Bands are contracting while MACD stays negative and Stochastic approaches oversold conditions, signaling weakening downside momentum.
5. Technical Summary: USOUSD is currently consolidating after a strong bearish move, with price confined within a narrow range. Momentum is fading on the downside, suggesting potential range-bound conditions until a breakout occurs.
Market Performance:
Commodities Last Price % Change
UKOUSD 76.77 −0.35%
Key Economic Calendar:
US: API Crude Oil Stock Change
JP: BoJ Summary of Opinions
AU: Inflation Rate MoM & YoY
AU: RBA Trimmed Mean CPI MoM & YoY
AU: RBA Hauser Speech
JP: BoJ Himino Speech
DE: Ifo Business Climate
US: MBA 30-Year Mortgage Rate
CA: BoC Rogers Speech
US: Current Account
US: New Home Sales & New Home Sales MoM
US: EIA Crude Oil & Gasoline Stocks Change
Risk Disclaimer: This report is for informational purposes only and does not constitute financial advice. Investments involve risks, and past performance does not guarantee future results. Consult your financial advisor for personalized investment strategies.
Disclaimer:
Le opinioni di questo articolo rappresentano solo le opinioni personali dell’autore e non costituiscono consulenza in materia di investimenti per questa piattaforma. La piattaforma non garantisce l’accuratezza, la completezza e la tempestività delle informazioni relative all’articolo, né è responsabile delle perdite causate dall’uso o dall’affidamento delle informazioni relative all’articolo.
WikiFX Trader
FOREX.com
Supervisione del paese
XM
Sotto supervisione
IC Markets Global
Sotto supervisione
eightcap
Sotto supervisione
Exness
Sotto supervisione
FXCM
Sotto supervisione
FOREX.com
Supervisione del paese
XM
Sotto supervisione
IC Markets Global
Sotto supervisione
eightcap
Sotto supervisione
Exness
Sotto supervisione
FXCM
Sotto supervisione
Rate Calc
USD

CNY
Tasso di cambio attuale:0
inserisci l'importo
USD
A disposizione
CNY
Calcolare 