

Broker Globale Piattaforma di Verifica Regolamentare
WikiFX
Italiano
简体中文
繁體中文
English
Pусский
日本語
ภาษาไทย
Tiếng Việt
Bahasa Indonesia
Español
हिन्दी
Filippiiniläinen
Français
Deutsch
Português
Türkçe
한국어
العربية
اردو
FPG GBPUSD Market Report April 21, 2026
Sommario:On the H1 timeframe chart, GBPUSD shows a sharp bullish impulse followed by a corrective phase and an early-stage recovery. Price previously surged from 1.3504 to 1.3598, forming a strong bullish spik
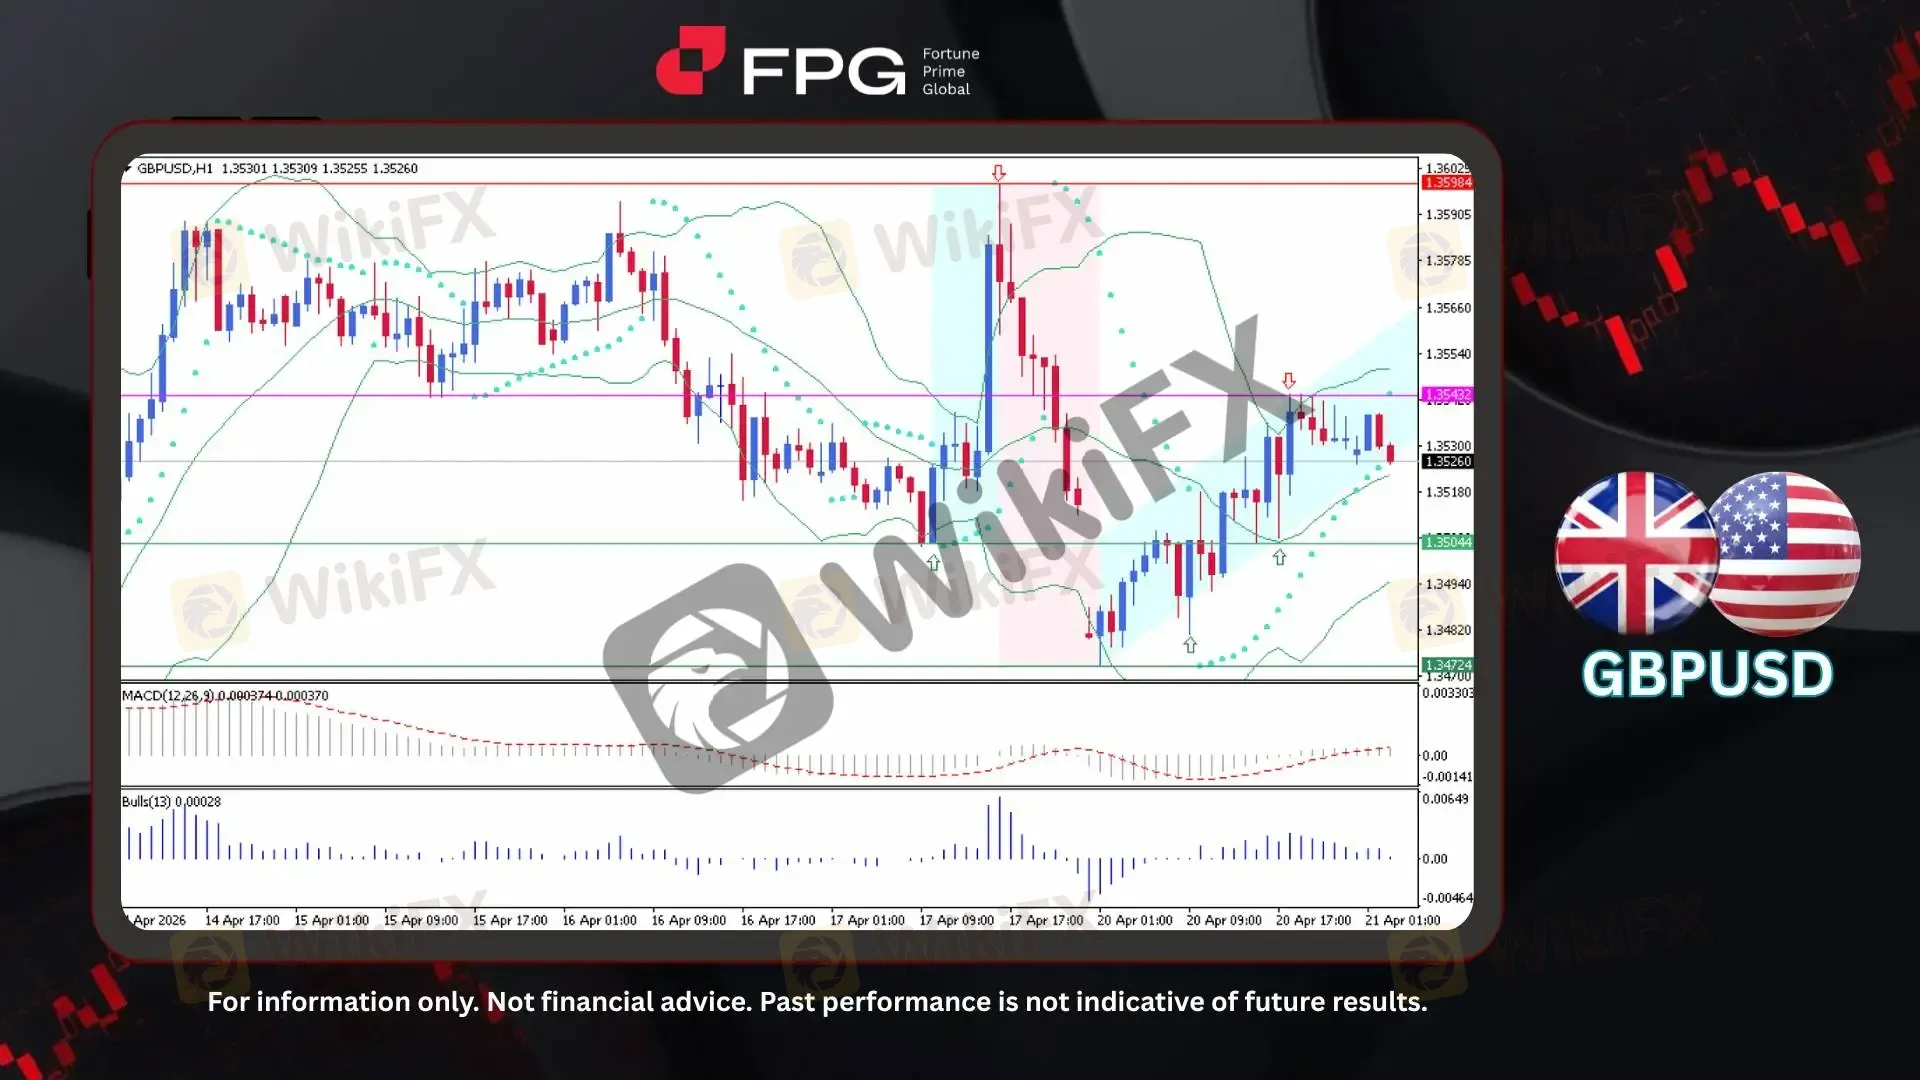
On the H1 timeframe chart, GBPUSD shows a sharp bullish impulse followed by a corrective phase and an early-stage recovery. Price previously surged from 1.3504 to 1.3598, forming a strong bullish spike before encountering resistance and reversing downward toward 1.3472. From this low, the market began to stabilize and form higher lows, developing into an ascending channel structure. The current price is trading around 1.3526, indicating a gradual recovery with moderate volatility as the market attempts to rebuild bullish momentum.
From a technical perspective, Bollinger Bands are slightly expanding, suggesting volatility is beginning to increase again after the recent consolidation phase. Price is currently trading near the middle band, reflecting a balance between buyers and sellers, though the ascending structure supports a mild bullish bias. The MACD (12,26,9) is hovering near the zero line at approximately 0.00037 / 0.00037, indicating neutral momentum with early signs of a potential bullish crossover. Meanwhile, the Bulls Power (13) is slightly positive around 0.00028, showing that buying pressure is returning, although still relatively weak and not yet dominant.
Recent economic developments across the UK and US reflect a mix of geopolitical risks, slowing growth, and cautious policy outlooks, with rising oil prices and global uncertainty adding pressure to markets and the US dollar. At the same time, the UK faces weaker growth prospects, potential increases in unemployment, and declining business confidence amid ongoing economic challenges. On the policy front, the UK is implementing energy market reforms while the Bank of England is expected to keep interest rates steady, whereas US conditions remain influenced by geopolitical tensions and inflation expectations. Despite these pressures, relatively stable UK policy compared to tightening US conditions may limit USD strength, supporting a short-term bullish bias on GBPUSD.
Technical Market Overview
1. Current Position: GBPUSD is trading around 1.3526, moving within an ascending channel after rebounding from recent lows.
2. Resistance Zone: The nearest resistance is located at 1.3543, followed by a stronger resistance at 1.3598, marking the recent peak.
3. Support Zone: Immediate support stands at 1.3504, with deeper support at 1.3472, representing the recent swing low.
4. Indicator Observation: Bollinger Bands are starting to expand, indicating rising volatility. MACD (12,26,9) is near the neutral zone with early signs of a bullish shift, while Bulls Power (13) remains slightly positive, reflecting gradual buying pressure.
5. Technical Summary: GBPUSD shows early signs of bullish recovery within an ascending structure, supported by stabilizing indicators. However, momentum remains relatively weak, and confirmation above resistance is needed to validate further upside continuation.
Market Performance:
Forex Last Price % Change
EUR/USD 1.1785 −0.05%
USD/JPY 158.90 +0.06%
Today's Key Economic Calendar:
UK: Average Earnings incl. Bonus (3Mo/Yr)
UK: Employment Change
UK: Unemployment Rate
CN: FDI (YTD) YoY
EU: ZEW Economic Sentiment Index
DE: ZEW Economic Sentiment Index
US: ADP Employment Change Weekly
US: Retail Sales Control Group MoM
US: Retail Sales Ex Autos MoM
US: Retail Sales MoM
US: Business Inventories MoM
US: Fed Chair Nominee Kevin Warsh Confirmation Hearing
US: Pending Home Sales MoM & YoY
Risk Disclaimer: This report is for informational purposes only and does not constitute financial advice. Investments involve risks, and past performance does not guarantee future results. Consult your financial advisor for personalized investment strategies.
Disclaimer:
Le opinioni di questo articolo rappresentano solo le opinioni personali dell’autore e non costituiscono consulenza in materia di investimenti per questa piattaforma. La piattaforma non garantisce l’accuratezza, la completezza e la tempestività delle informazioni relative all’articolo, né è responsabile delle perdite causate dall’uso o dall’affidamento delle informazioni relative all’articolo.
WikiFX Trader
XM
Sotto supervisione
EBC FINANCIAL GROUP
Sotto supervisione
D prime
Supervisione del paese
HFM
Sotto supervisione
TMGM
Sotto supervisione
TICKMILL
Sotto supervisione
XM
Sotto supervisione
EBC FINANCIAL GROUP
Sotto supervisione
D prime
Supervisione del paese
HFM
Sotto supervisione
TMGM
Sotto supervisione
TICKMILL
Sotto supervisione
Rate Calc
USD

CNY
Tasso di cambio attuale:0
inserisci l'importo
USD
A disposizione
CNY
Calcolare 