

Broker Globale Piattaforma di Verifica Regolamentare
WikiFX
Italiano
简体中文
繁體中文
English
Pусский
日本語
ภาษาไทย
Tiếng Việt
Bahasa Indonesia
Español
हिन्दी
Filippiiniläinen
Français
Deutsch
Português
Türkçe
한국어
العربية
اردو
FPG XAUUSD Market Report April 20, 2026
Sommario:XAUUSD (Gold) on the H1 timeframe chart has recently experienced a fairly significant price drop from 4889 to 4737. A week ago, there was a bullish rally from around 4700, forming a bullish channel up
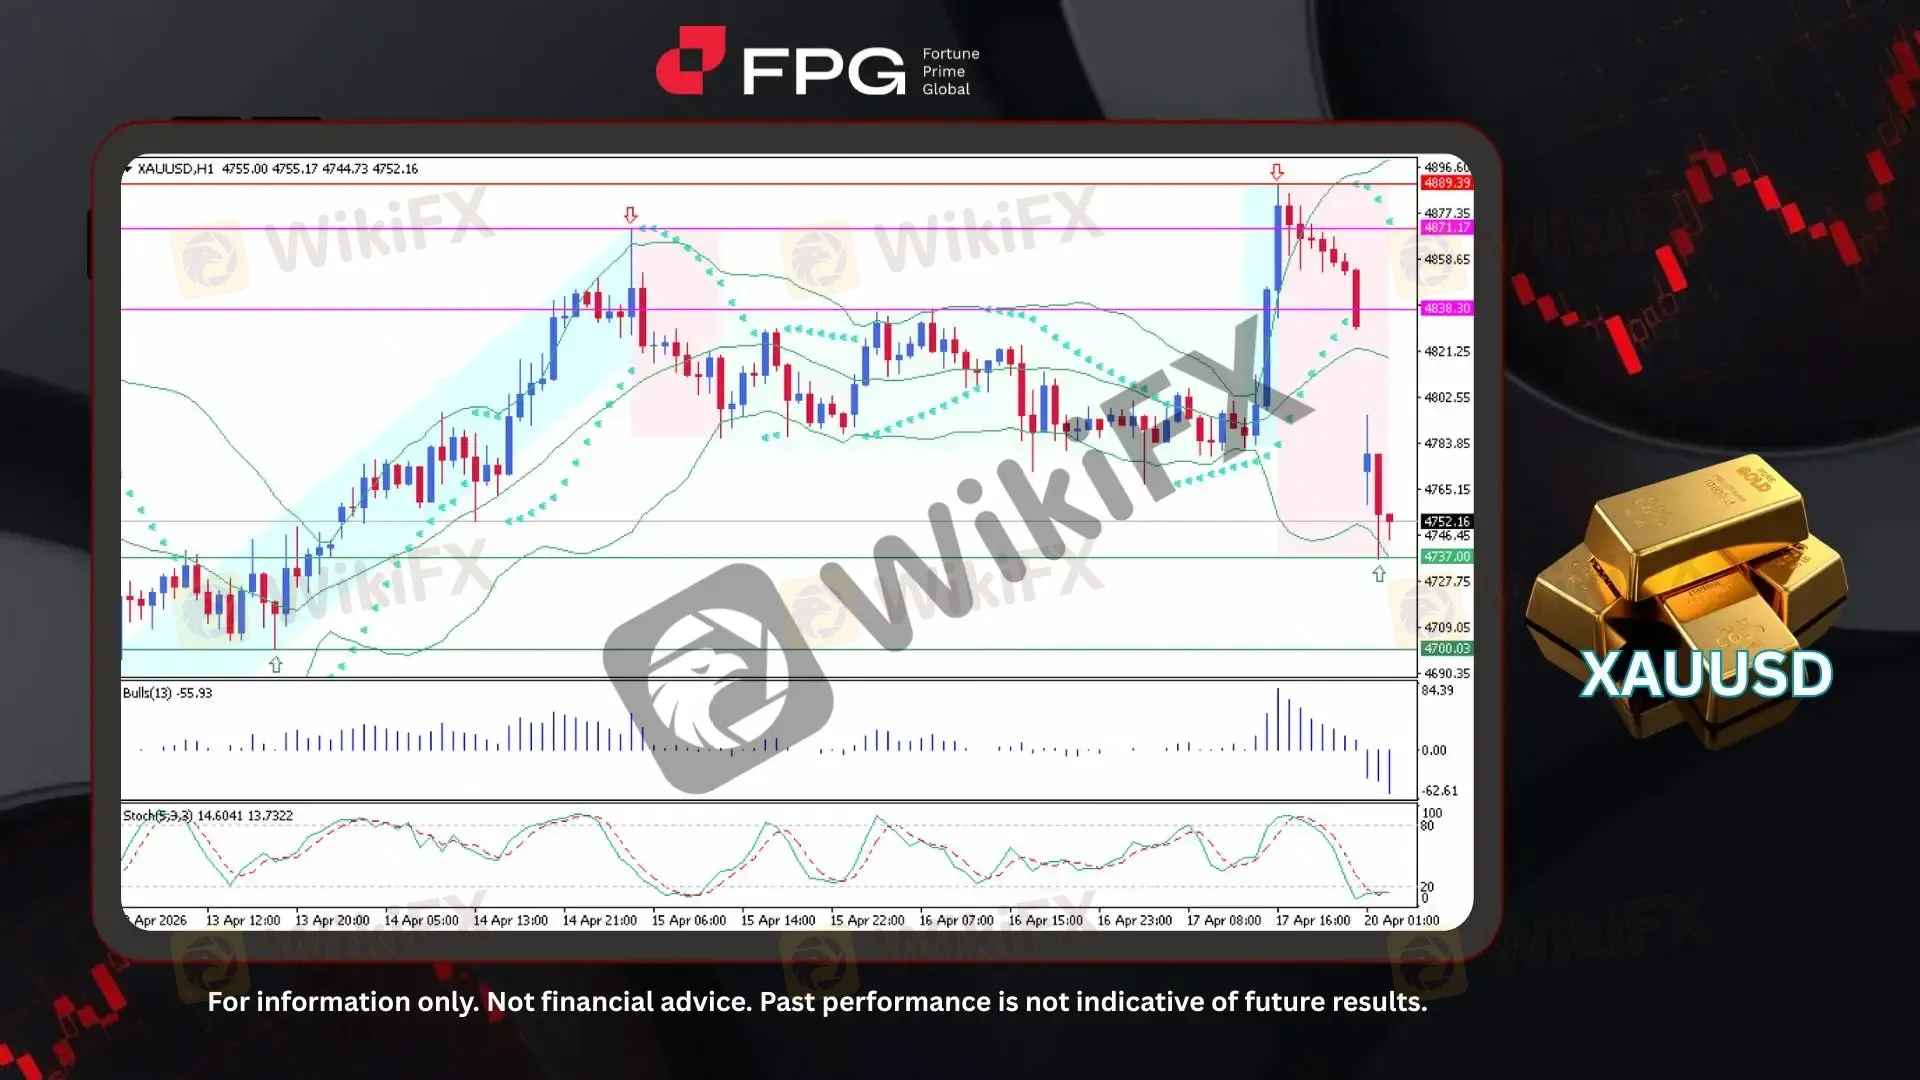
XAUUSD (Gold) on the H1 timeframe chart has recently experienced a fairly significant price drop from 4889 to 4737. A week ago, there was a bullish rally from around 4700, forming a bullish channel up to 4871. This was followed by a period of price consolidation lasting several days. Price then attempted to strengthen before ultimately undergoing a recent decline. The price is currently hovering around 4752, with market volatility still remaining elevated and indicating continued price fluctuations.
From a technical perspective, the recent sharp decline has pushed price toward the lower boundary of the Bollinger Bands, indicating strong bearish momentum and increased volatility. The Parabolic SAR has flipped above the price, reinforcing the short-term bearish bias. Meanwhile, the Stochastic oscillator is hovering near the oversold zone, suggesting that although selling pressure remains dominant, a potential short-term rebound or consolidation could occur. Key support is seen around 4737, followed by the stronger support level near 4700, while immediate resistance is located at 4838 and stronger resistance at 4871.
Recent reports indicate that gold prices have declined due to a stronger U.S. dollar and reduced expectations of near-term Federal Reserve rate cuts amid persistent inflation. Meanwhile, global economic conditions remain fragile, with geopolitical tensions and energy shocks keeping inflation elevated and forcing central banks to maintain tight monetary policy. These factors support a higher-for-longer interest rate outlook globally. As a result, gold has weakened, as higher yields and a stronger dollar reduce its appeal as a non-yielding asset.
Technical Market Overview
1. Current Position: XAUUSD is currently trading around 4752, maintaining a short-term bearish bias after a sharp rejection from the 4889 high. The price has moved below the previous consolidation range, while volatility remains elevated.
2. Resistance Zone: The nearest resistance is located at 4838, and a stronger resistance zone is seen at 4871–4889, which marks the previous swing high and rejection area.
3. Support Zone: Immediate support is positioned at 4737, the recent low. A deeper and more significant support zone is located around 4700, which previously acted as the base of the bullish rally.
4. Indicator Observation: Bollinger Bands show price expanding toward the lower band, indicating strong bearish momentum and increased volatility. The Parabolic SAR has shifted above price, confirming a bearish trend. Meanwhile, the Stochastic oscillator is near the oversold region, suggesting potential for a short-term bounce or consolidation.
5. Technical Summary: The overall structure has shifted bearish in the short term following a strong rejection at the highs. While momentum favors further downside, oversold conditions may trigger a temporary pullback. Price action near the 4737–4700 support zone will be critical in determining whether the decline continues or stabilizes.
Market Performance:
Precious Metals Last Price % Change
XPTUSD 2,067.53 −0.91%
XAGUSD 79.3698 −1.77%
Today's Key Economic Calendar:
CN: Loan Prime Rate 1Y & 5Y
DE: PPI YoY
CN: FDI (YTD) YoY
CA: Core Inflation Rate YoY
CA: Inflation Rate MoM & YoY
CA: BoC Business Outlook Survey
CA: BoC Survey of Consumer Expectations
EU: ECB President Lagarde Speech
Risk Disclaimer: This report is for informational purposes only and does not constitute financial advice. Investments involve risks, and past performance does not guarantee future results. Consult your financial advisor for personalized investment strategies.
Disclaimer:
Le opinioni di questo articolo rappresentano solo le opinioni personali dell’autore e non costituiscono consulenza in materia di investimenti per questa piattaforma. La piattaforma non garantisce l’accuratezza, la completezza e la tempestività delle informazioni relative all’articolo, né è responsabile delle perdite causate dall’uso o dall’affidamento delle informazioni relative all’articolo.
WikiFX Trader
D prime
Supervisione del paese
XM
Sotto supervisione
EC markets
Sotto supervisione
AVATRADE
Sotto supervisione
FXCM
Sotto supervisione
IC Markets Global
Sotto supervisione
D prime
Supervisione del paese
XM
Sotto supervisione
EC markets
Sotto supervisione
AVATRADE
Sotto supervisione
FXCM
Sotto supervisione
IC Markets Global
Sotto supervisione
Rate Calc
USD

CNY
Tasso di cambio attuale:0
inserisci l'importo
USD
A disposizione
CNY
Calcolare 