
Broker Globale Piattaforma di Verifica Regolamentare
WikiFX
English
简体中文
繁體中文
English
Pусский
日本語
ภาษาไทย
Tiếng Việt
Bahasa Indonesia
Español
हिन्दी
Filippiiniläinen
Français
Deutsch
Português
Türkçe
한국어
العربية
FPG USOUSD Market Report April 8, 2026
Sommario:On the H4 timeframe chart, USOUSD shows a very significant price drop. Previously, the market formed two consecutive bullish rallies, starting from 86.81 and advancing to 107.10, before undergoing a b
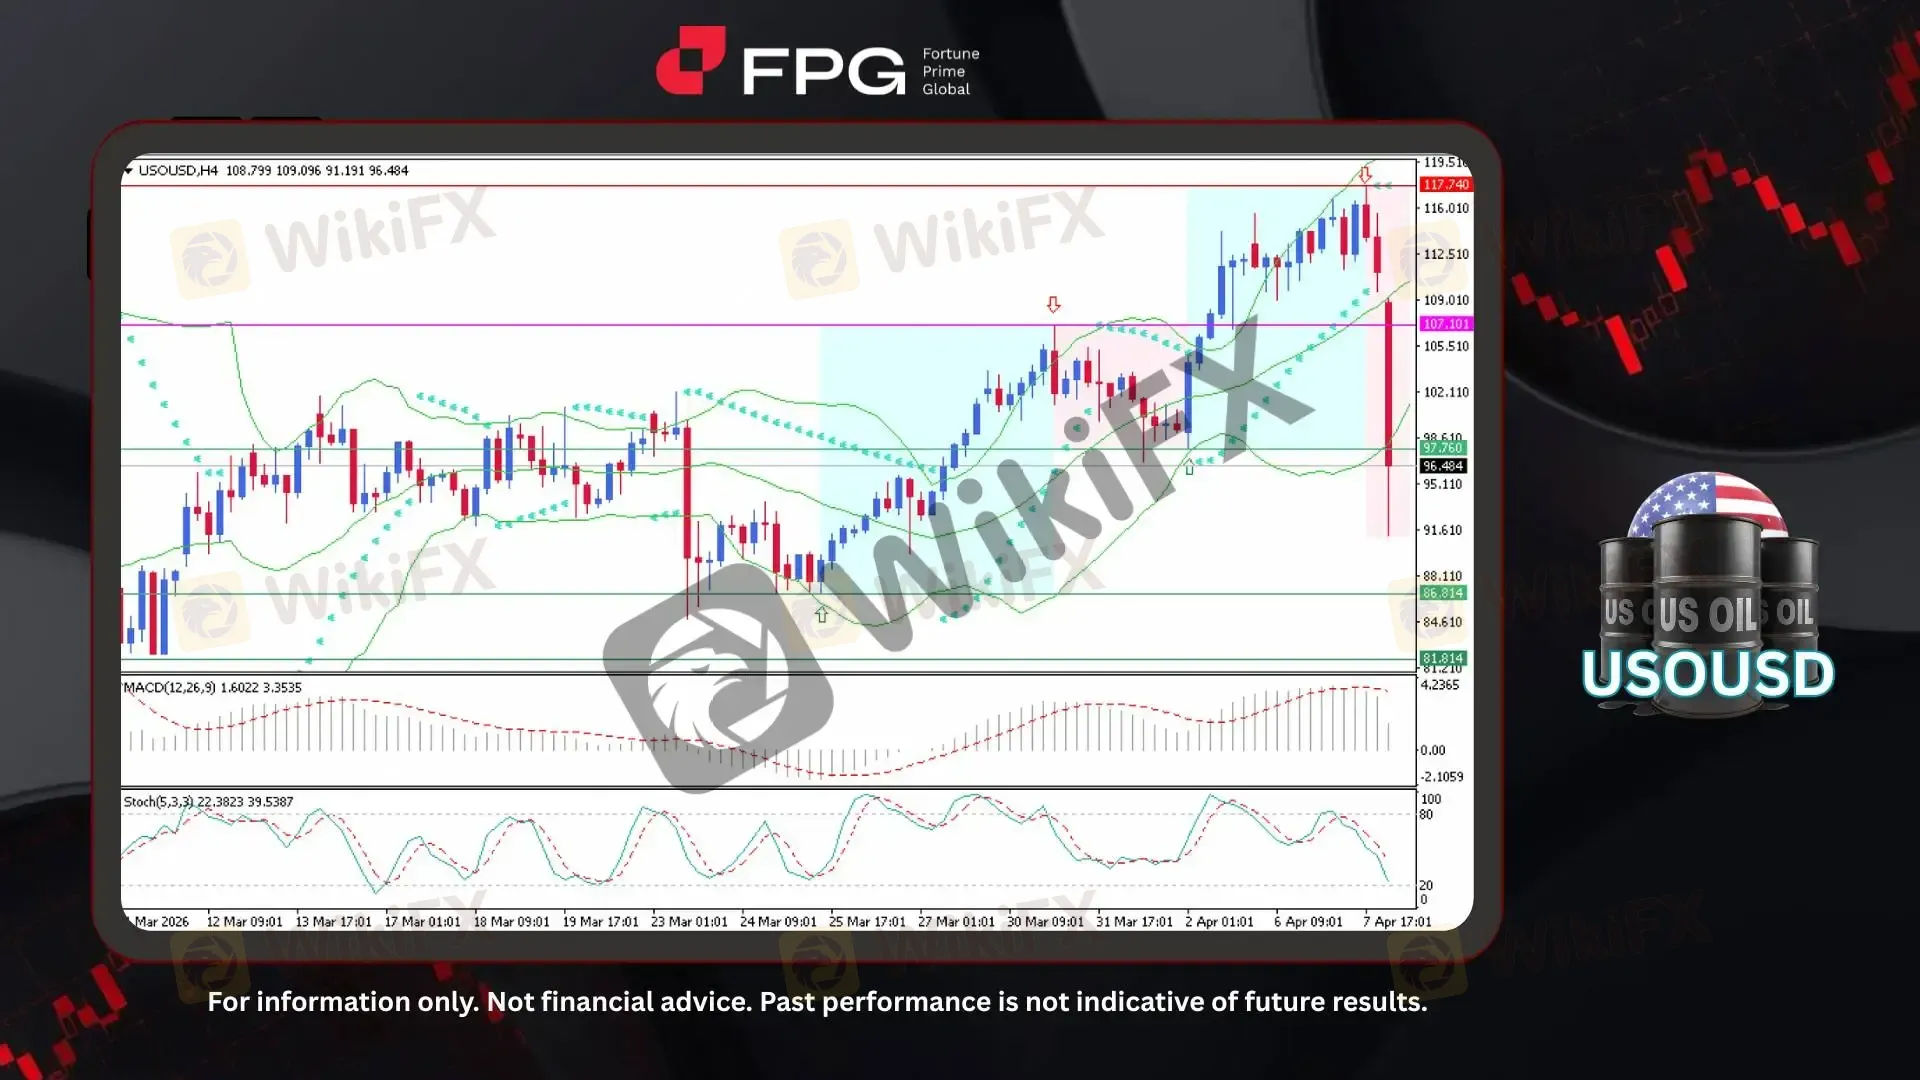
On the H4 timeframe chart, USOUSD shows a very significant price drop. Previously, the market formed two consecutive bullish rallies, starting from 86.81 and advancing to 107.10, before undergoing a bearish correction toward 97.76. After this pullback, the price resumed its upward movement and continued to rally, eventually reaching a peak at 117.74, marking a key resistance zone. From this peak, the market experienced a sharp bearish reversal, leading to an aggressive sell-off that pushed the price down rapidly to around 91.61 within a short period. This sudden decline reflects strong selling pressure and a shift in market sentiment. The current price is trading around 96.48, showing signs of stabilization but still within a relatively high volatility environment.
From a technical perspective, price action has clearly broken below the mid-Bollinger Band and briefly broke the lower band, indicating strong bearish momentum and increased volatility expansion after a prior period of consolidation. The Bollinger Bands are now widening, suggesting that the market is entering a high-volatility phase. The Parabolic SAR has flipped above the price, confirming a bearish trend reversal signal. Meanwhile, the MACD shows a bearish crossover with the histogram declining sharply, reflecting increasing downside momentum. The Stochastic oscillator is also moving downward and approaching the oversold region, indicating that selling pressure remains dominant, although a short-term corrective bounce cannot be ruled out.
This price drop is clearly driven by fundamental factors, as recent developments indicate a fragile de-escalation between the US and Iran, including a temporary ceasefire tied to efforts to stabilize the Strait of Hormuz, although tensions remain elevated. Iran continues to leverage its control over the strait by restricting and selectively allowing maritime traffic, signaling strategic pressure rather than a full blockade. Meanwhile, the US and its allies are considering a combination of diplomatic, economic, and potential military measures to ensure the reopening and security of this critical oil transit route. As a result, global energy markets remain under pressure, with supply disruptions prompting shifts in trade flows and sustaining uncertainty across the broader economic outlook.
Technical Market Overview
1. Current Position: USOUSD is trading around 96.48 after experiencing a sharp bearish decline from the recent high at 117.74. The price is currently attempting to stabilize following a rapid sell-off, but remains under pressure within a high-volatility environment.
2. Resistance Zone: The nearest resistance is located at 97.76, which aligns with the previous support turned resistance. A stronger resistance level is seen at 107.10, representing a key structural level and prior breakout zone.
3. Support Zone: Immediate support is found at 91.61, marking the recent sharp decline low. A deeper support level is located at 86.81, which previously acted as a strong base during the earlier bullish phase.
4. Indicator Observation: Bollinger Bands show expansion, indicating increasing volatility following the sharp price drop. Price has broken below the middle band and tested the lower band, signaling strong bearish momentum. Parabolic SAR has shifted above the price, confirming a bearish trend reversal. MACD reflects a bearish crossover with declining histogram, indicating strengthening downside momentum. Stochastic is moving toward the oversold area, suggesting persistent selling pressure with potential for a short-term rebound.
5. Technical Summary: The market has shifted from a bullish structure into a bearish phase following a sharp reversal from the 117.74 level. Momentum indicators support continued downside pressure, although oversold conditions may trigger temporary corrective rebounds. Overall, the bias remains bearish in the short term unless the price is able to reclaim key resistance levels.
Market Performance:
Commodities Last Price % Change
UKOUSD 97.53 −10.12%
Today's Key Economic Calendar:
US: API Crude Oil Stock Change
US: Fed Jefferson Speech
JP: Current Account
DE: Factory Orders MoM
UK: Halifax House Price Index MoM & YoY
UK: S&P Global Construction PMI
EU: Retail Sales MoM
US: MBA 30-Year Mortgage Rate
US: EIA Crude Oil & Gasoline Stocks Change
Risk Disclaimer: This report is for informational purposes only and does not constitute financial advice. Investments involve risks, and past performance does not guarantee future results. Consult your financial advisor for personalized investment strategies.
Disclaimer:
Le opinioni di questo articolo rappresentano solo le opinioni personali dell’autore e non costituiscono consulenza in materia di investimenti per questa piattaforma. La piattaforma non garantisce l’accuratezza, la completezza e la tempestività delle informazioni relative all’articolo, né è responsabile delle perdite causate dall’uso o dall’affidamento delle informazioni relative all’articolo.
WikiFX Trader
FXCM
Sotto supervisione
GO Markets
Sotto supervisione
VT Markets
Sotto supervisione
AVATRADE
Sotto supervisione
EC markets
Sotto supervisione
Exness
Sotto supervisione
FXCM
Sotto supervisione
GO Markets
Sotto supervisione
VT Markets
Sotto supervisione
AVATRADE
Sotto supervisione
EC markets
Sotto supervisione
Exness
Sotto supervisione
Rate Calc
USD

CNY
Tasso di cambio attuale:0
inserisci l'importo
USD
A disposizione
CNY
Calcolare 