
Broker Globale Piattaforma di Verifica Regolamentare
WikiFX
English
简体中文
繁體中文
English
Pусский
日本語
ภาษาไทย
Tiếng Việt
Bahasa Indonesia
Español
हिन्दी
Filippiiniläinen
Français
Deutsch
Português
Türkçe
한국어
العربية
Is the Bottom In? Identifying Market Reversals with the Double Bottom Pattern Part 2
Sommario:4. Double Bottom Trading StrategyAfter going through the previous section, I believe most of us do realise that the entry point for the double bottom pattern lies at the neckline. These are the two do
4. Double Bottom Trading Strategy
After going through the previous section, I believe most of us do realise that the entry point for the double bottom pattern lies at the neckline. These are the two double bottom pattern entry as below:
The Breakout
Enter as soon as the price effectively closes above the neckline.
Pro: You don't miss the move.
Con: Higher risk of a "fakeout."
The Retest
Wait for the price to break out, then pull back to touch the neckline (now support) before entering.
Pro: High-probability entry with a clear stop-loss.
Con: The market may surge and never pull back.
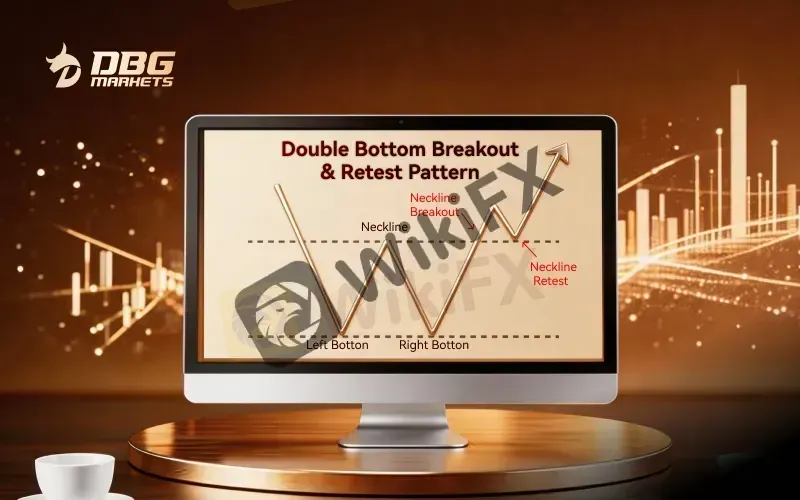
Note: The first entry opportunity exists in all double bottom patterns. Meanwhile, the neckline retest, which represents the second buying opportunity, may not always occur. sometimes the momentum is so strong that the price never looks back.
5. Example: The NASDAQ Index ReversalAfter understand the trading technique and profit target calculation for the double bottom, next, we will look at how we can apply them into trading through a real-life example.
Lets look at a real-world example: the Nasdaq 100 (UT100) in late 2022. After a grueling bear market year, the index formed a clear Double Bottom on the daily chart.
The pattern effectively identified the end of the bear market. Once the index broke the neckline, it confirmed the shift in sentiment, leading to the birth of a new bullish trend.
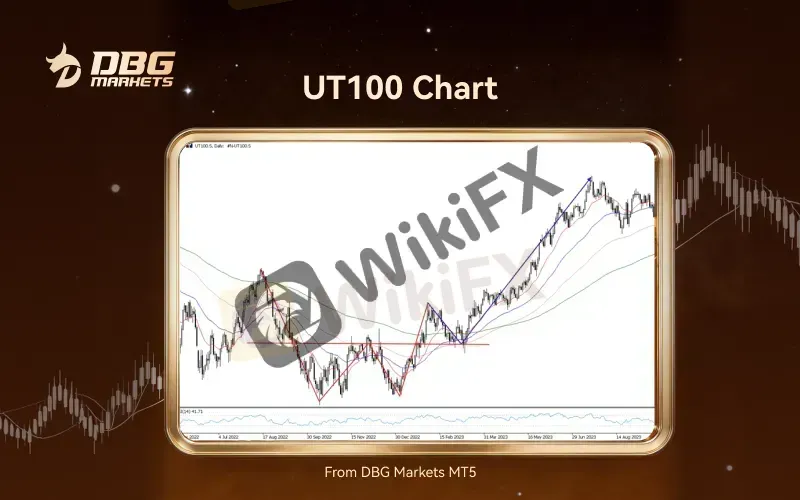
Nasdaq100 (UT100), DBG Markets MT56. Conclusion: Patience Over PredictionWhen an asset enters a bear market, the most dangerous move is trying to guess the exact bottom. Instead of "catching a falling knife," professional traders wait for a reversal signal like the Double Bottom to confirm that the trend has actually changed.
No pattern is 100% accurate—nothing can perfectly predict the market. However, using the "W" pattern increases your odds significantly. By following a disciplined entry at the neckline and setting targets based on the pattern's height, you can maximize your rewards while strictly minimizing your risk.
DBG Markets encourages all traders to combine this technical insight with sound risk management to navigate today's volatile equity markets.

Disclaimer:
Le opinioni di questo articolo rappresentano solo le opinioni personali dell’autore e non costituiscono consulenza in materia di investimenti per questa piattaforma. La piattaforma non garantisce l’accuratezza, la completezza e la tempestività delle informazioni relative all’articolo, né è responsabile delle perdite causate dall’uso o dall’affidamento delle informazioni relative all’articolo.
WikiFX Trader
GO Markets
Sotto supervisione
IC Markets Global
Sotto supervisione
D prime
Supervisione del paese
TMGM
Sotto supervisione
XM
Sotto supervisione
TICKMILL
Sotto supervisione
GO Markets
Sotto supervisione
IC Markets Global
Sotto supervisione
D prime
Supervisione del paese
TMGM
Sotto supervisione
XM
Sotto supervisione
TICKMILL
Sotto supervisione
Rate Calc
USD

CNY
Tasso di cambio attuale:0
inserisci l'importo
USD
A disposizione
CNY
Calcolare 