
Broker Globale Piattaforma di Verifica Regolamentare
WikiFX
English
简体中文
繁體中文
English
Pусский
日本語
ภาษาไทย
Tiếng Việt
Bahasa Indonesia
Español
हिन्दी
Filippiiniläinen
Français
Deutsch
Português
Türkçe
한국어
العربية
FPG USOUSD Market Report April 6, 2026
Sommario:On the H4 timeframe chart, USOUSD shows that the latest price trend has successfully broken above the resistance at 107.10, with the current price trading around 112.70 under relatively high volatilit
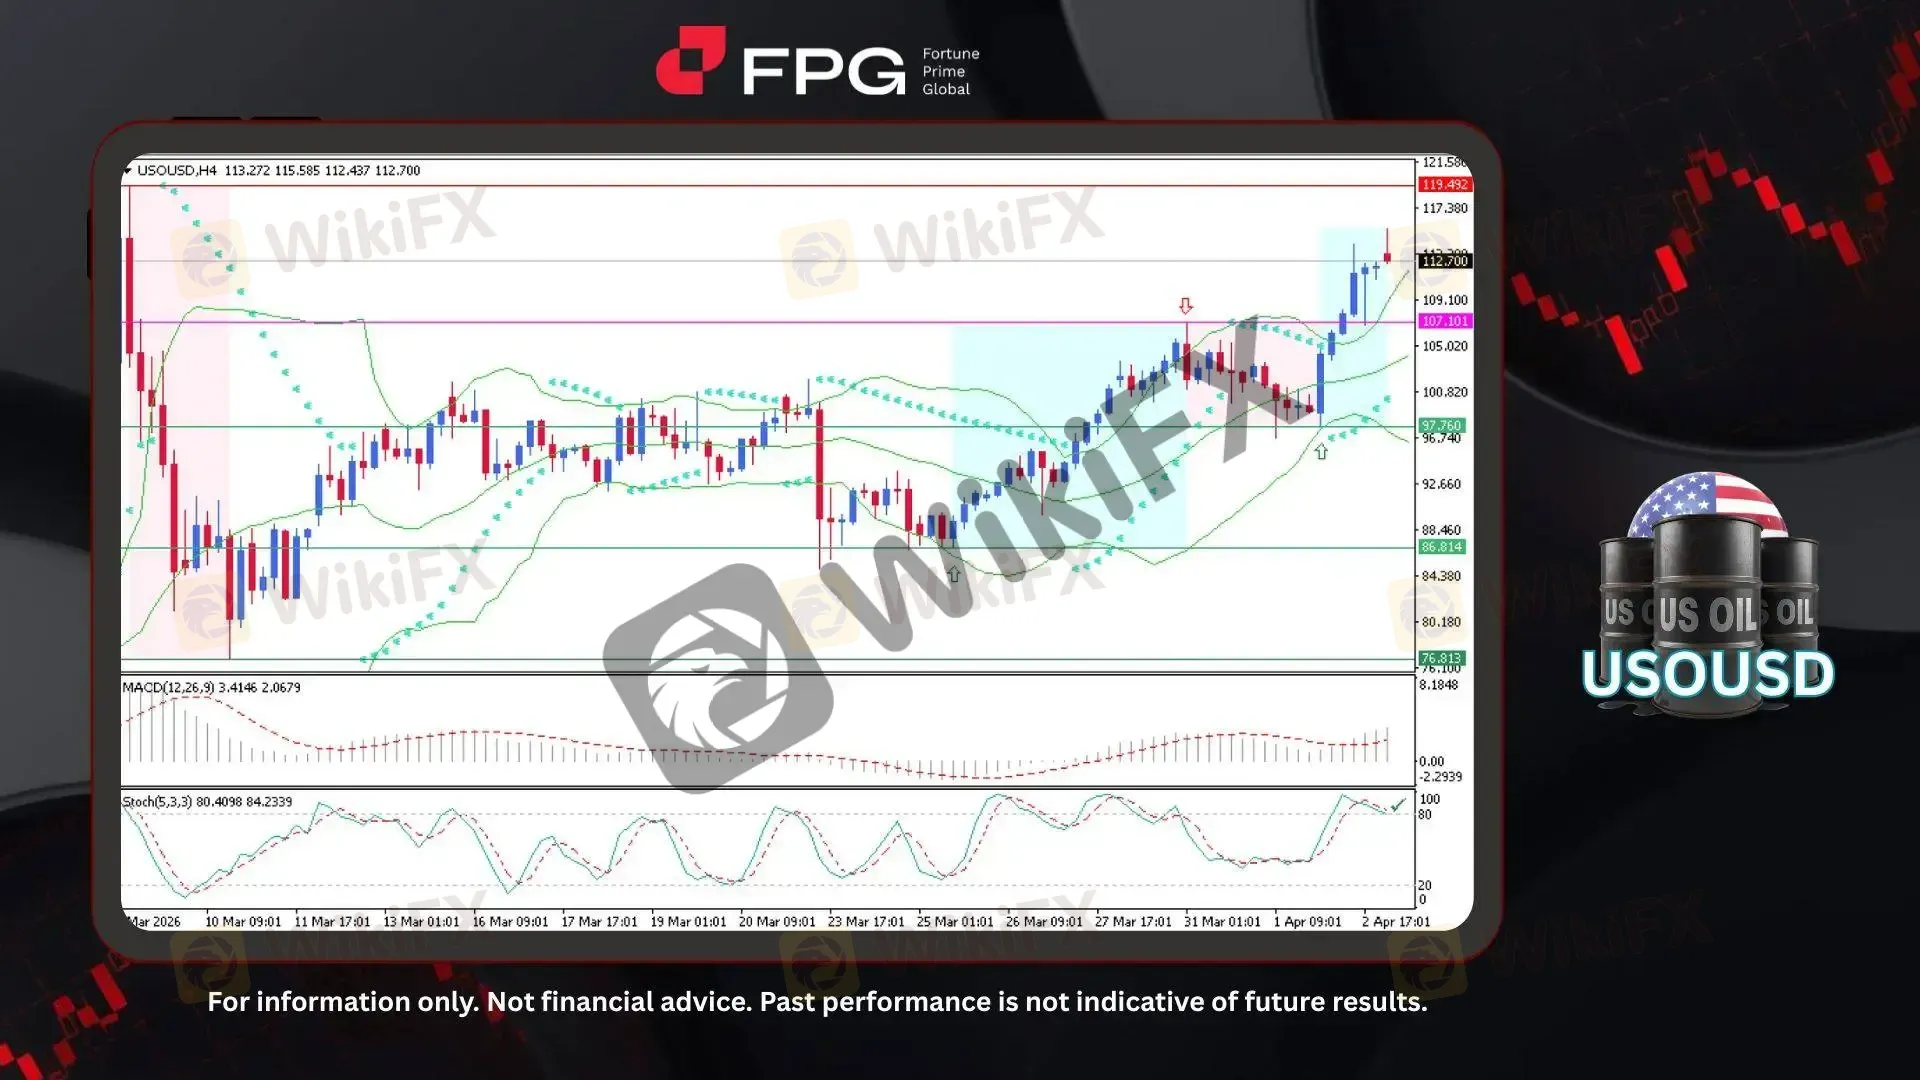
On the H4 timeframe chart, USOUSD shows that the latest price trend has successfully broken above the resistance at 107.10, with the current price trading around 112.70 under relatively high volatility. After previously experiencing a sharp decline from 119.49 to 76.81 at the beginning of last month, the price has gradually recovered, forming a clear bullish structure. During this recovery phase, two additional support levels have developed at 86.81 and 97.76, reinforcing the upward trend. The current movement toward 119.49 indicates a continuation of bullish pressure, although recent candlestick formations suggest early signs of weakening momentum near the upper range.
From a technical perspective, Bollinger Bands are expanding again following the recent breakout, indicating a renewed increase in volatility as price pushes higher. Price is currently trading above the upper band, reflecting strong bullish pressure but also signaling a potential exhaustion zone. The MACD (12,26,9) remains in positive territory with the histogram still elevated, confirming that bullish momentum is active, although the slope has begun to flatten slightly. Meanwhile, the Stochastic Oscillator (5,3,3) is positioned around 80–84, indicating overbought conditions, which aligns with the observed slowdown in upward momentum and suggests a potential consolidation phase or short-term correction.
Global oil prices have surged sharply in early April amid escalating geopolitical tensions involving Iran, disrupting key supply routes such as the Strait of Hormuz and tightening global energy availability. The conflict has led to attacks on critical oil infrastructure across the Middle East, increasing market volatility and raising concerns over sustained supply disruptions. In response, OPEC+ has signaled potential output adjustments while major economies explore policy measures to stabilize energy markets, though uncertainty remains elevated. The resulting supply shock is fueling inflationary pressures, increasing transportation and production costs, and heightening global economic risks as markets react to prolonged instability.
Technical Market Overview
1. Current Position: USOUSD is trading around 112.70, maintaining a bullish structure after breaking above the 107.10 resistance, with price approaching the upper resistance zone.
2. Resistance Zone: The nearest resistance is located at 119.49, representing the previous major swing high and a key supply area.
3. Support Zone: Immediate support stands at 97.76, followed by 86.81, both acting as key structural levels from the recent recovery phase.
4. Indicator Observation: Bollinger Bands show renewed expansion with price above the upper band, indicating strong but stretched bullish momentum. The MACD (12,26,9) remains positive with a slightly flattening histogram, while the Stochastic Oscillator (5,3,3) is in overbought territory around 80–84, reflecting slowing momentum near the highs.
5. Technical Summary: Price structure is in a strong bullish recovery phase approaching a major resistance zone, with momentum indicators remaining positive but showing early signs of exhaustion under elevated volatility conditions.
Market Performance:
Commodities Last Price % Change
UKOUSD 113.36 +1.13%
Today's Key Economic Calendar:
FR: 12, 6 & 3-Month BTF Auction
CA: S&P Global Composite & Services PMI
US: ISM Services PMI
Risk Disclaimer: This report is for informational purposes only and does not constitute financial advice. Investments involve risks, and past performance does not guarantee future results. Consult your financial advisor for personalized investment strategies.
Disclaimer:
Le opinioni di questo articolo rappresentano solo le opinioni personali dell’autore e non costituiscono consulenza in materia di investimenti per questa piattaforma. La piattaforma non garantisce l’accuratezza, la completezza e la tempestività delle informazioni relative all’articolo, né è responsabile delle perdite causate dall’uso o dall’affidamento delle informazioni relative all’articolo.
WikiFX Trader
FOREX.com
Supervisione del paese
TMGM
Sotto supervisione
XM
Sotto supervisione
VT Markets
Sotto supervisione
IC Markets Global
Sotto supervisione
HFM
Sotto supervisione
FOREX.com
Supervisione del paese
TMGM
Sotto supervisione
XM
Sotto supervisione
VT Markets
Sotto supervisione
IC Markets Global
Sotto supervisione
HFM
Sotto supervisione
Rate Calc
USD

CNY
Tasso di cambio attuale:0
inserisci l'importo
USD
A disposizione
CNY
Calcolare 