
Broker Globale Piattaforma di Verifica Regolamentare
WikiFX
English
简体中文
繁體中文
English
Pусский
日本語
ภาษาไทย
Tiếng Việt
Bahasa Indonesia
Español
हिन्दी
Filippiiniläinen
Français
Deutsch
Português
Türkçe
한국어
العربية
FPG BTCUSD Market Report March 19, 2026
Sommario:On the H1 timeframe chart, BTCUSD initially showed a strong bullish rally starting from 70,397 and peaking at 75,993, reflecting strong buying momentum in the early phase. From that peak, the price en
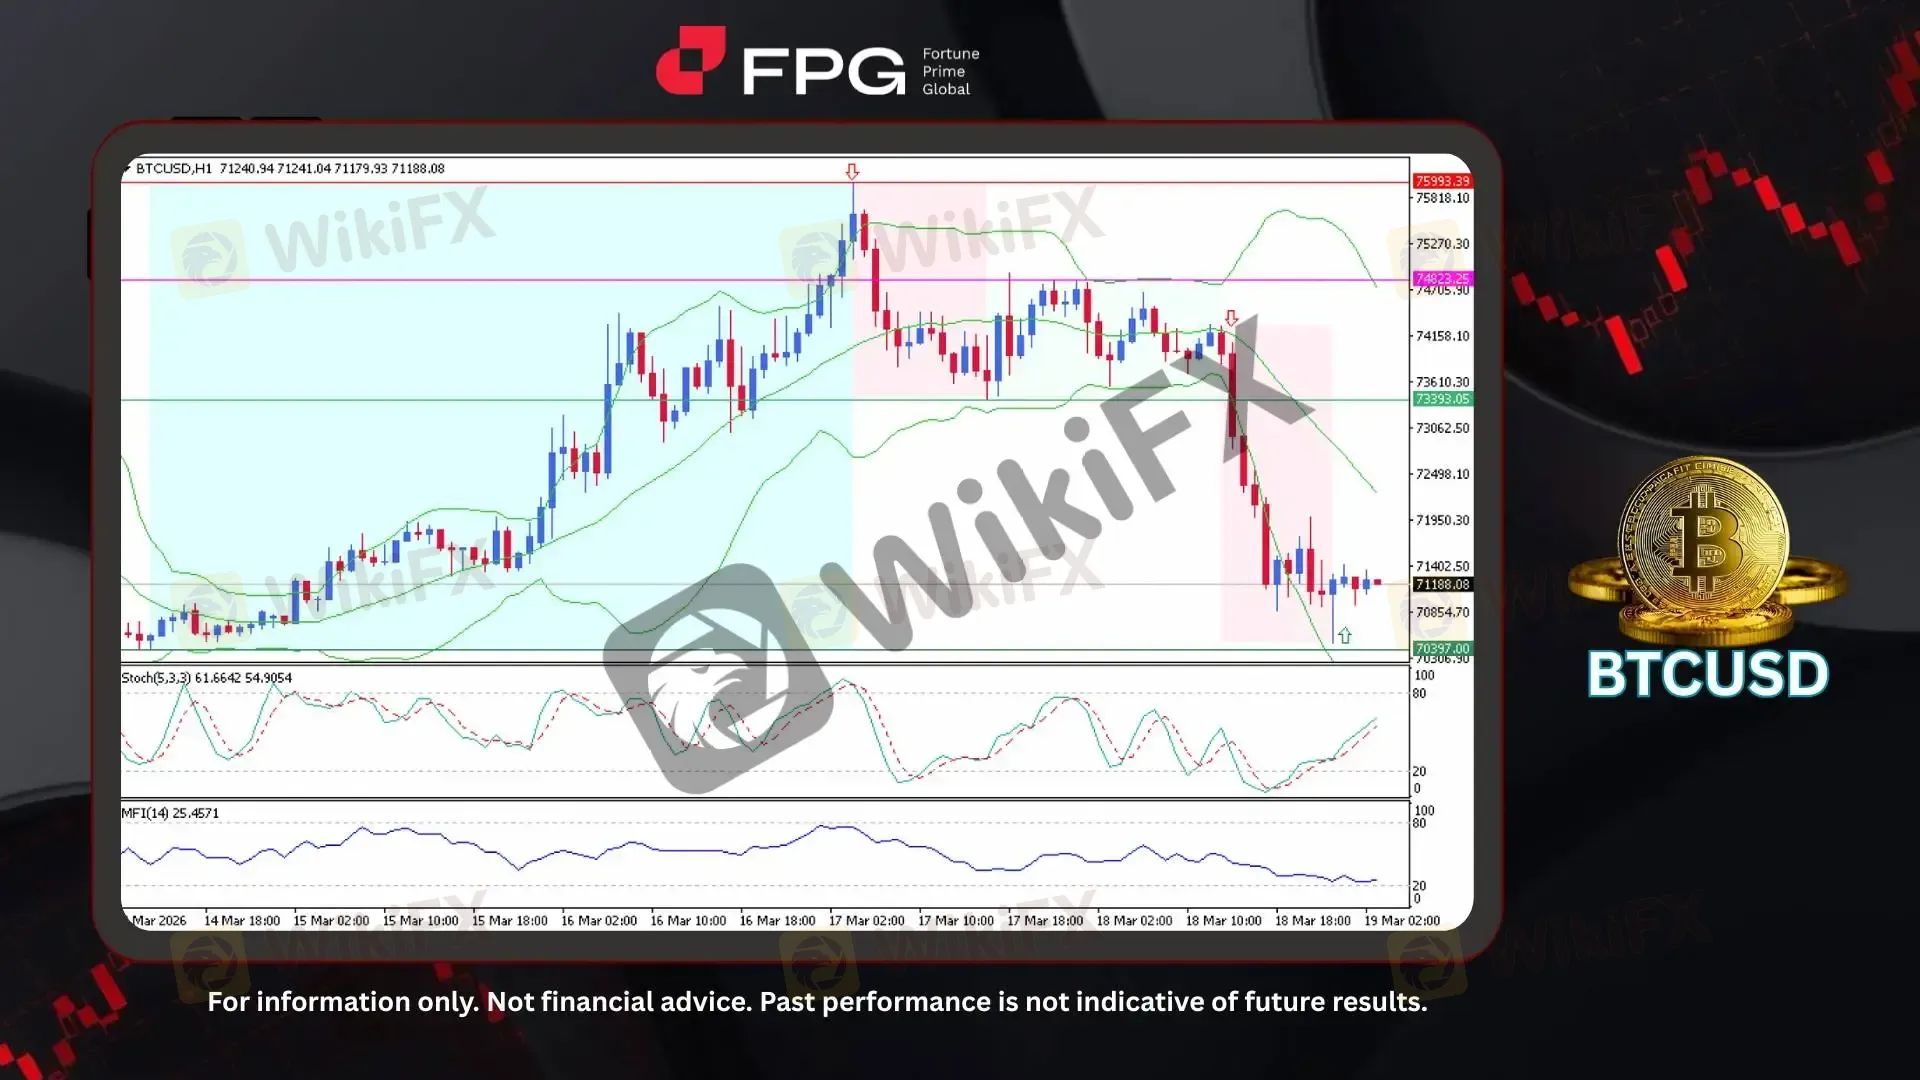
On the H1 timeframe chart, BTCUSD initially showed a strong bullish rally starting from 70,397 and peaking at 75,993, reflecting strong buying momentum in the early phase. From that peak, the price entered a corrective phase and briefly moved sideways, indicating a pause in bullish strength. This was followed by a continued bearish move from around 74,158, pushing price lower and nearly retesting the key support level at 70,397. The current price stands at 71,188, with a series of relatively stable short-bodied candles, suggesting consolidation and reduced volatility after the recent decline.
From a technical indicator perspective, price is currently trading near the lower band of the Bollinger Bands, which typically indicates that selling pressure may be nearing exhaustion and a short-term rebound could develop. The Stochastic Oscillator is gradually turning upward from the oversold region, signaling a potential bullish correction in the near term. Meanwhile, the Money Flow Index (MFI) remains at relatively low levels, reflecting weak buying pressure and limited capital inflow into the market. Overall, these indicators suggest that while downside momentum is slowing, the market has yet to show strong confirmation of a sustained bullish reversal.
Bitcoin has been moving in a volatile sideways pattern, largely driven by shifting expectations around monetary policy and global liquidity conditions. Market sentiment remains mixed as investors weigh cautious macroeconomic signals against optimism from institutional demand and ongoing ETF inflows. Geopolitical tensions have also influenced Bitcoins dual role as both a risk asset and a potential safe haven, adding complexity to its price behavior. At the same time, evolving regulatory developments and political support continue to shape longer-term confidence, even as short-term uncertainty keeps overall price action unstable.
Technical Market Overview
1. Current Position: BTCUSD is trading around 71,188, stabilizing after a strong bearish decline from the recent high near 75,993. Price action is currently consolidating near the lower range, with small-bodied candles reflecting reduced volatility and indecision.
2. Resistance Zone: The nearest resistance is located around 73,393, acting as a key structure level where previous support has turned into resistance. A higher resistance zone is seen near 74,823, which aligns with prior consolidation and rejection areas.
3. Support Zone: Immediate support is positioned around 70,397, representing the recent swing low and a critical demand zone. A breakdown below this level may trigger further downside momentum.
4. Indicator Observation: Bollinger Bands show price hovering near the lower band, suggesting potential exhaustion of selling pressure. The Stochastic Oscillator is turning upward from the oversold region, indicating a possible short-term bullish correction. Meanwhile, the Money Flow Index (MFI) remains low, reflecting weak buying interest and limited inflow of capital.
5. Technical Summary: The short-term trend remains bearish following the recent breakdown, but momentum is beginning to slow. Indicators suggest a potential consolidation or minor rebound, although a confirmed bullish reversal has not yet been established.
Market Performance:
Crypto Last Price % Change
ETHUSD 2,198.9 −0.20%
SOLUSD 89.99 −0.10%
Today's Key Economic Calendar:
US: Fed Interest Rate Decision
US: FOMC Economic Projections
US: Fed Press Conference
US: Net Long–term TIC Flows
JP: Machinery Orders MoM & YoY
AU: Employment & Full Time Employment Change
AU: Unemployment Rate
JP: BoJ Gov Ueda Speech
JP: BoJ Interest Rate Decision
UK: Average Earnings incl. Bonus (3 Mo/Yr)
UK: Employment Change & Unemployment Rate
CN: FDI (YTD) YoY
UK: BoE Interest Rate Decision
UK: BoE MPC Vote Cut, Hike, & Unchanged
UK: MPC Meeting Minutes
US: Initial Jobless Claims
US: Philadelphia Fed Manufacturing Index
EU: Deposit Facility Rate
EU: ECB Interest Rate Decision
EU: ECB Press Conference
US: New Home Sales & New Home Sales MoM
Risk Disclaimer: This report is for informational purposes only and does not constitute financial advice. Investments involve risks, and past performance does not guarantee future results. Consult your financial advisor for personalized investment strategies.
Disclaimer:
Le opinioni di questo articolo rappresentano solo le opinioni personali dell’autore e non costituiscono consulenza in materia di investimenti per questa piattaforma. La piattaforma non garantisce l’accuratezza, la completezza e la tempestività delle informazioni relative all’articolo, né è responsabile delle perdite causate dall’uso o dall’affidamento delle informazioni relative all’articolo.
WikiFX Trader
TMGM
Sotto supervisione
EBC FINANCIAL GROUP
Sotto supervisione
FOREX.com
Supervisione del paese
FXCM
Sotto supervisione
eightcap
Sotto supervisione
HFM
Sotto supervisione
TMGM
Sotto supervisione
EBC FINANCIAL GROUP
Sotto supervisione
FOREX.com
Supervisione del paese
FXCM
Sotto supervisione
eightcap
Sotto supervisione
HFM
Sotto supervisione
Rate Calc
USD

CNY
Tasso di cambio attuale:0
inserisci l'importo
USD
A disposizione
CNY
Calcolare 