
Applicazione di richiesta di informazioni sulla regolamentazione dei broker globali
WikiFX
English
简体中文
繁體中文
English
Pусский
日本語
ภาษาไทย
Tiếng Việt
Bahasa Indonesia
Español
हिन्दी
Filippiiniläinen
Français
Deutsch
Português
Türkçe
한국어
العربية
FPG AUDUSD Market Report March 17, 2026
Sommario:On the H1 timeframe chart, AUDUSD previously experienced a sharp decline from 0.7186 to 0.6978, forming a clearly defined bearish channel during the downward move. Price briefly moved outside the chan
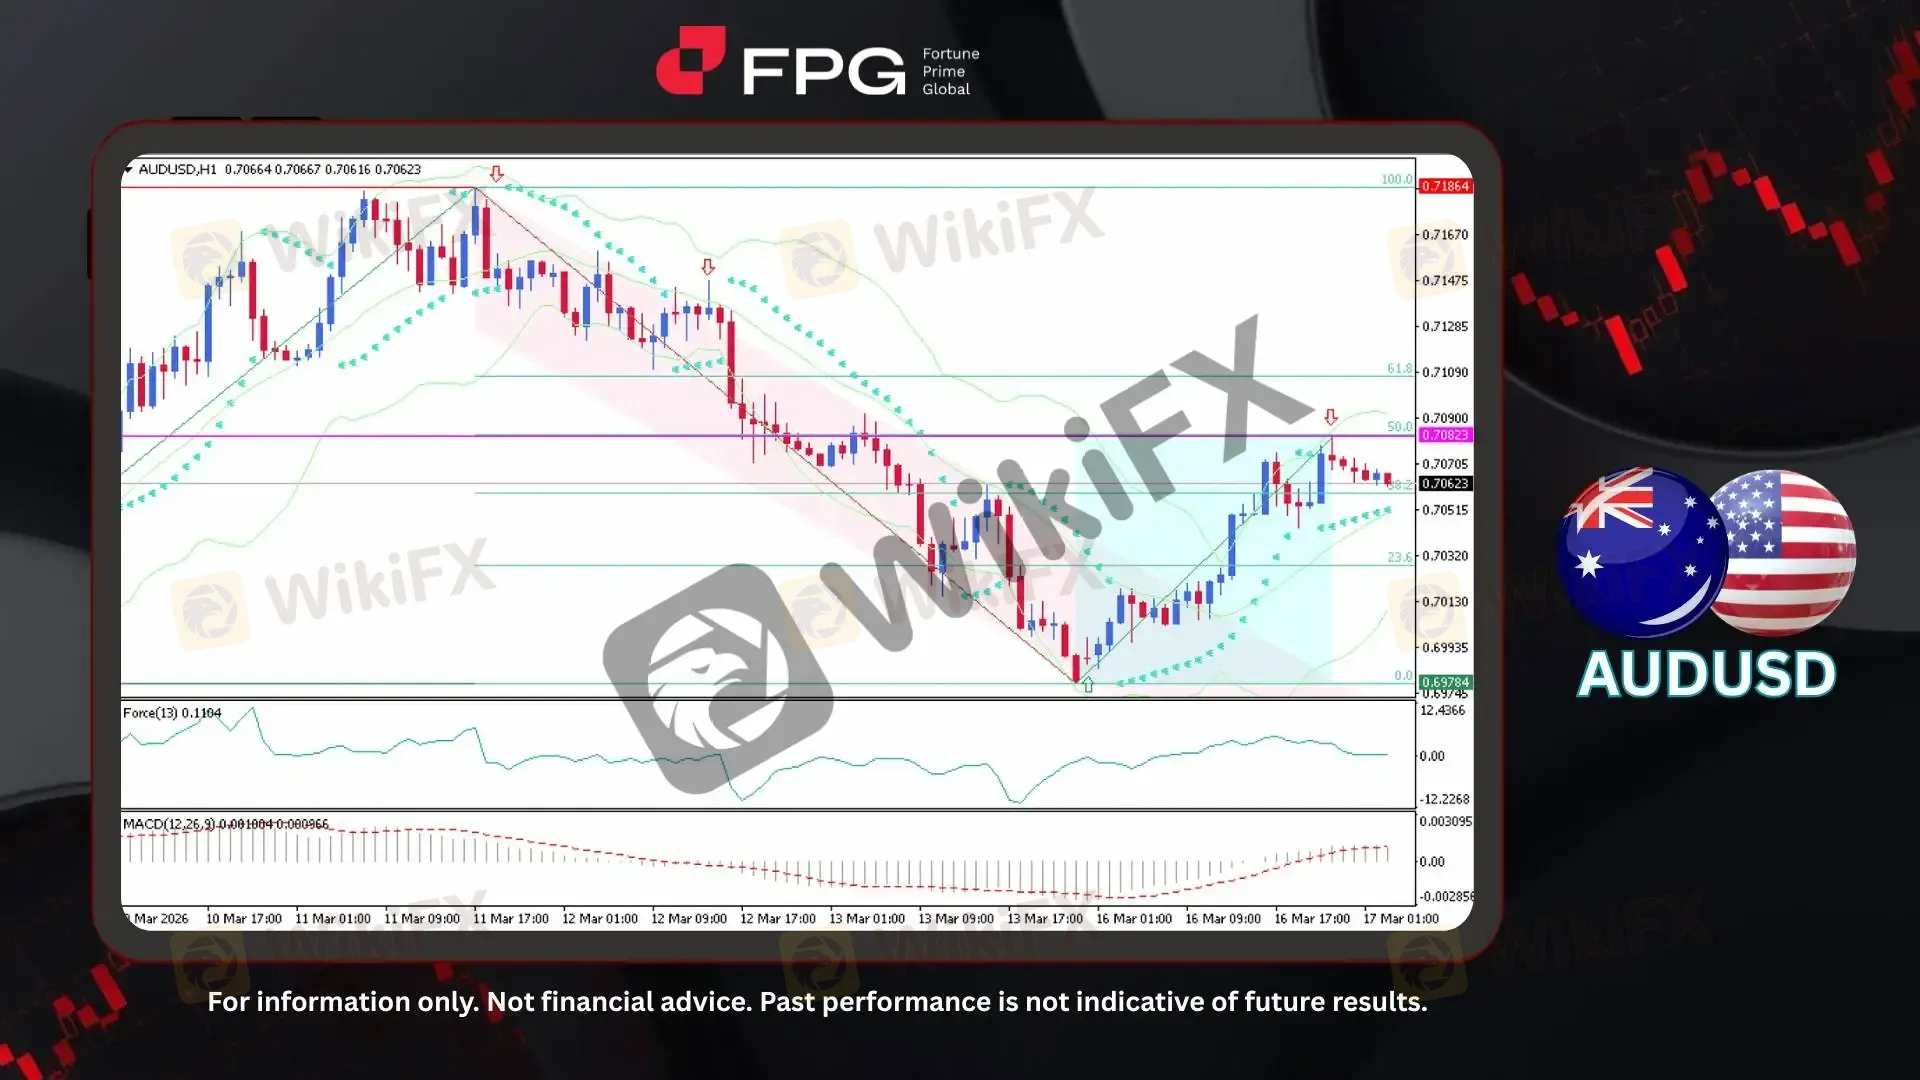
On the H1 timeframe chart, AUDUSD previously experienced a sharp decline from 0.7186 to 0.6978, forming a clearly defined bearish channel during the downward move. Price briefly moved outside the channel structure but soon corrected and returned back within the channel boundaries, confirming the persistence of the bearish trend at that stage. From the lower boundary near 0.6978, a bullish rebound then developed, pushing the pair higher toward 0.7082, which aligns closely with the 50% Fibonacci retracement level of the prior decline. Currently, AUDUSD is trading around 0.7062, showing moderate volatility as price stabilizes after the recent recovery attempt.
From a technical perspective, Bollinger Bands remain moderately expanded following the previous decline, indicating continued market volatility during the transition from bearish momentum into a corrective rebound. Price is currently fluctuating around the mid-band area after testing the Fibonacci resistance zone. The Force Index (13) remains slightly above the neutral level, suggesting that buying pressure has improved during the recent rebound phase. Meanwhile, the MACD (12,26,9) has gradually moved upward toward the zero line with the histogram turning positive, indicating that bearish momentum is fading and that short-term bullish momentum is beginning to develop following the earlier decline.
Despite experiencing a prolonged period of weakness against the U.S. Dollar, the Australian Dollar has recently staged a rebound as market sentiment improved and expectations grew that the Reserve Bank of Australia may maintain a relatively tighter monetary stance due to persistent inflation pressures. At the same time, investors remain cautious regarding the Federal Reserves policy outlook, as rising energy prices and geopolitical risks continue to influence the trajectory of U.S. inflation. This combination of improving risk sentiment and shifting rate expectations has helped support the AUDUSD pair after its earlier bearish phase. Overall, while the broader trend remains sensitive to global risk sentiment, the recent rebound suggests that short-term buying interest has started to emerge in the Australian dollar.
Technical Market Overview
1. Current Position: AUDUSD is trading around 0.7062, fluctuating below the 50% Fibonacci retracement level (0.7082) following the recent rebound from the 0.6978 swing low.
2. Resistance Zone: The nearest resistance is located around 0.7082, which corresponds with the 50% Fibonacci retracement level and the recent pullback structure.
3. Support Zone: Immediate support is positioned near 0.6978, representing the recent swing low that formed the base of the latest bullish rebound.
4. Indicator Observation: Bollinger Bands show moderate volatility as price fluctuates near the mid-band following the recovery from the recent low. The Force Index (13) remains slightly positive, indicating improving buying pressure, while the MACD (12,26,9) has moved closer to the zero line with a positive histogram, suggesting that bearish momentum is weakening while short-term bullish momentum begins to build.
5. Technical Summary: AUDUSD is currently in a corrective rebound phase following the prior bearish channel decline from the recent high. Momentum indicators reflect gradually improving bullish pressure while price consolidates below the 50% Fibonacci retracement level within a broader recovery structure.
Market Performance:
Forex Last Price % Change
EUR/USD 1.1490 −0.13%
USD/JPY 159.24 +0.12%
Today's Key Economic Calendar:
AU: RBA Interest Rate Decision
AU: RBA Press Conference
CN: FDI (YTD) YoY
DE: ZEW Economic Sentiment Index
EU: ZEW Economic Sentiment Index
US: ADP Employment Change Weekly
US: Pending Home Sales MoM & YoY
Risk Disclaimer: This report is for informational purposes only and does not constitute financial advice. Investments involve risks, and past performance does not guarantee future results. Consult your financial advisor for personalized investment strategies.
Disclaimer:
Le opinioni di questo articolo rappresentano solo le opinioni personali dell’autore e non costituiscono consulenza in materia di investimenti per questa piattaforma. La piattaforma non garantisce l’accuratezza, la completezza e la tempestività delle informazioni relative all’articolo, né è responsabile delle perdite causate dall’uso o dall’affidamento delle informazioni relative all’articolo.
WikiFX Trader
FXTM
Sotto supervisione
EC markets
Sotto supervisione
HFM
Sotto supervisione
IC Markets Global
Sotto supervisione
TMGM
Sotto supervisione
AVATRADE
Sotto supervisione
FXTM
Sotto supervisione
EC markets
Sotto supervisione
HFM
Sotto supervisione
IC Markets Global
Sotto supervisione
TMGM
Sotto supervisione
AVATRADE
Sotto supervisione
Rate Calc
USD

CNY
Tasso di cambio attuale:0
inserisci l'importo
USD
A disposizione
CNY
Calcolare 