
Applicazione di richiesta di informazioni sulla regolamentazione dei broker globali
WikiFX
English
简体中文
繁體中文
English
Pусский
日本語
ภาษาไทย
Tiếng Việt
Bahasa Indonesia
Español
हिन्दी
Filippiiniläinen
Français
Deutsch
Português
Türkçe
한국어
العربية
Gold Breaks Down, Opening a New Downside Channel
Sommario:Major U.S. equity indices, along with gold and silver, declined in tandem. Short positions initiated over the past two sessions have begun to generate positive returns as the market moved lower.Lookin
Major U.S. equity indices, along with gold and silver, declined in tandem. Short positions initiated over the past two sessions have begun to generate positive returns as the market moved lower.
Looking ahead, we expect gold to remain biased toward consolidation with a downside tilt during the Lunar New Year period, with the probability of further declines outweighing upside potential.
A key development worth highlighting is the renewed “hot money” effect. The recent appreciation of both the Chinese yuan and Japanese yen has driven sovereign bond yields in the two countries lower, with part of the liquidity spilling over into equity markets. Liquidity-driven rallies often require little fundamental justification. This capital flow dynamic is likely to provide near-term support for Chinese, Japanese, and Korean equities, creating a short-term bullish impulse.
However, from a broader macro perspective, such hot money inflows are inherently unsustainable. A stronger currency typically weighs on corporate profitability unless productivity gains — potentially driven by AI-led innovation — significantly enhance efficiency. We believe achieving such structural gains remains challenging in the near term.
Investors should be cautious of a potential topping phase within the next one to two months. Once speculative capital retreats, equity markets may face corrective pressure.
In simple terms: when the music stops, dont be the last one left clearing the table.
Chart Analysis
(Chart 1: Corporate Earnings vs. A-Share Index | Source: MacroMicro)Purple Line: Corporate Earnings
Green Line: A-Share Index
As shown in Chart 1, a comparison between Chinese corporate earnings and the A-share market reveals a notable divergence. In 2015, liquidity-driven capital flows propelled a significant rally in A-shares, despite earnings failing to keep pace.
A similar pattern appears to be emerging in 2026, suggesting the current A-share rally may also be liquidity-driven rather than fundamentally supported. Investors should recognize the potentially unsustainable nature of this advance.
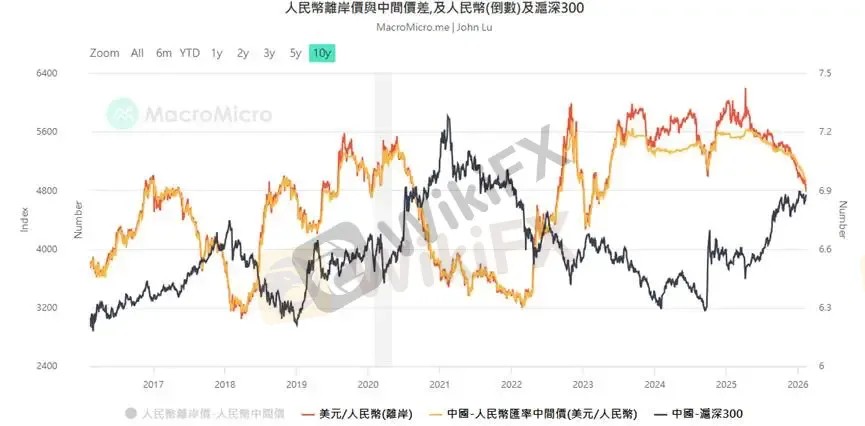
(Chart 2: USD/CNY vs. CSI 300 Index | Source: MacroMicro)
Chart 2 further reinforces the liquidity-driven narrative. The USD/CNY exchange rate appreciated from 7.4 to 6.9, coinciding with a strong rally in the CSI 300 Index.
This currency strength implies that Asian markets may outperform U.S. equities in the post-holiday period, as capital flows remain supportive in the short term.
Technical Analysis
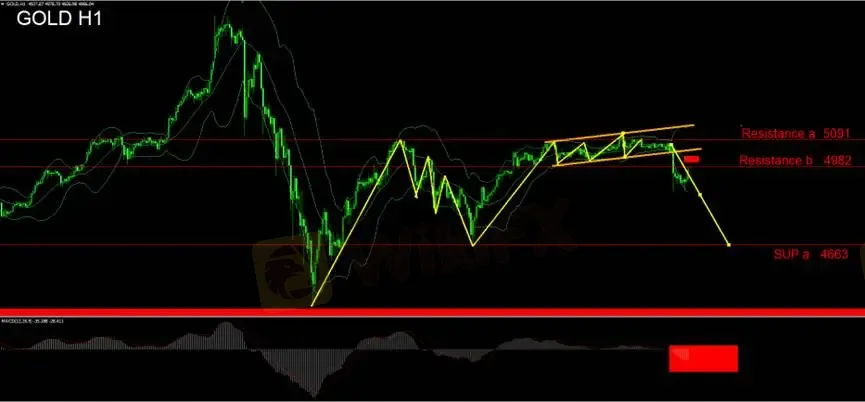
After three consecutive sessions of sideways consolidation, the price broke below its range-bound structure during the U.S. session yesterday. The 5,000 level now risks becoming a near-term ceiling.
Tracking Bollinger Bands dynamics, the bands have shifted from contraction to expansion following yesterdays decline. Investors should closely monitor whether the bands begin expanding to the downside, which would signal the potential onset of a medium-term corrective phase.
From a momentum perspective, the hourly MACD histogram has turned negative and is expanding, supporting short positioning. Immediate overhead resistance should be monitored at the Bollinger middle band.
Strategy Outlook
Focus on resistance at the Bollinger middle band. If the hourly chart confirms a downside reversal with a bearish close, traders may consider adding to short positions.
Those without existing exposure may initiate light short positions.
Should price continue trending lower along the Bollinger middle band, each test of that resistance may present an opportunity to scale in. Investors are advised to trade with the prevailing trend and avoid bottom-fishing.
Key Levels
Resistance A: 5091
Support A: 4663
Support B: 4982
Risk Disclosure
The views, analyses, research, price data, or other information provided above are intended solely as general market commentary and do not represent the official position of this platform. Readers assume full responsibility for their investment decisions and associated risks. Please trade prudently.
Disclaimer:
Le opinioni di questo articolo rappresentano solo le opinioni personali dell’autore e non costituiscono consulenza in materia di investimenti per questa piattaforma. La piattaforma non garantisce l’accuratezza, la completezza e la tempestività delle informazioni relative all’articolo, né è responsabile delle perdite causate dall’uso o dall’affidamento delle informazioni relative all’articolo.
WikiFX Trader
Rate Calc
USD

CNY
Tasso di cambio attuale:0
inserisci l'importo
USD
A disposizione
CNY
Calcolare 