
Applicazione di richiesta di informazioni sulla regolamentazione dei broker globali
WikiFX
English
简体中文
繁體中文
English
Pусский
日本語
ภาษาไทย
Tiếng Việt
Bahasa Indonesia
Español
हिन्दी
Filippiiniläinen
Français
Deutsch
Português
Türkçe
한국어
العربية
FPG USDJPY Market Report February 13, 2026
Sommario:On the H4 timeframe, USDJPY previously experienced a sharp decline from 159.22 down to 152.08, reflecting strong bearish pressure in the market. After reaching that low, price staged a bullish rebound
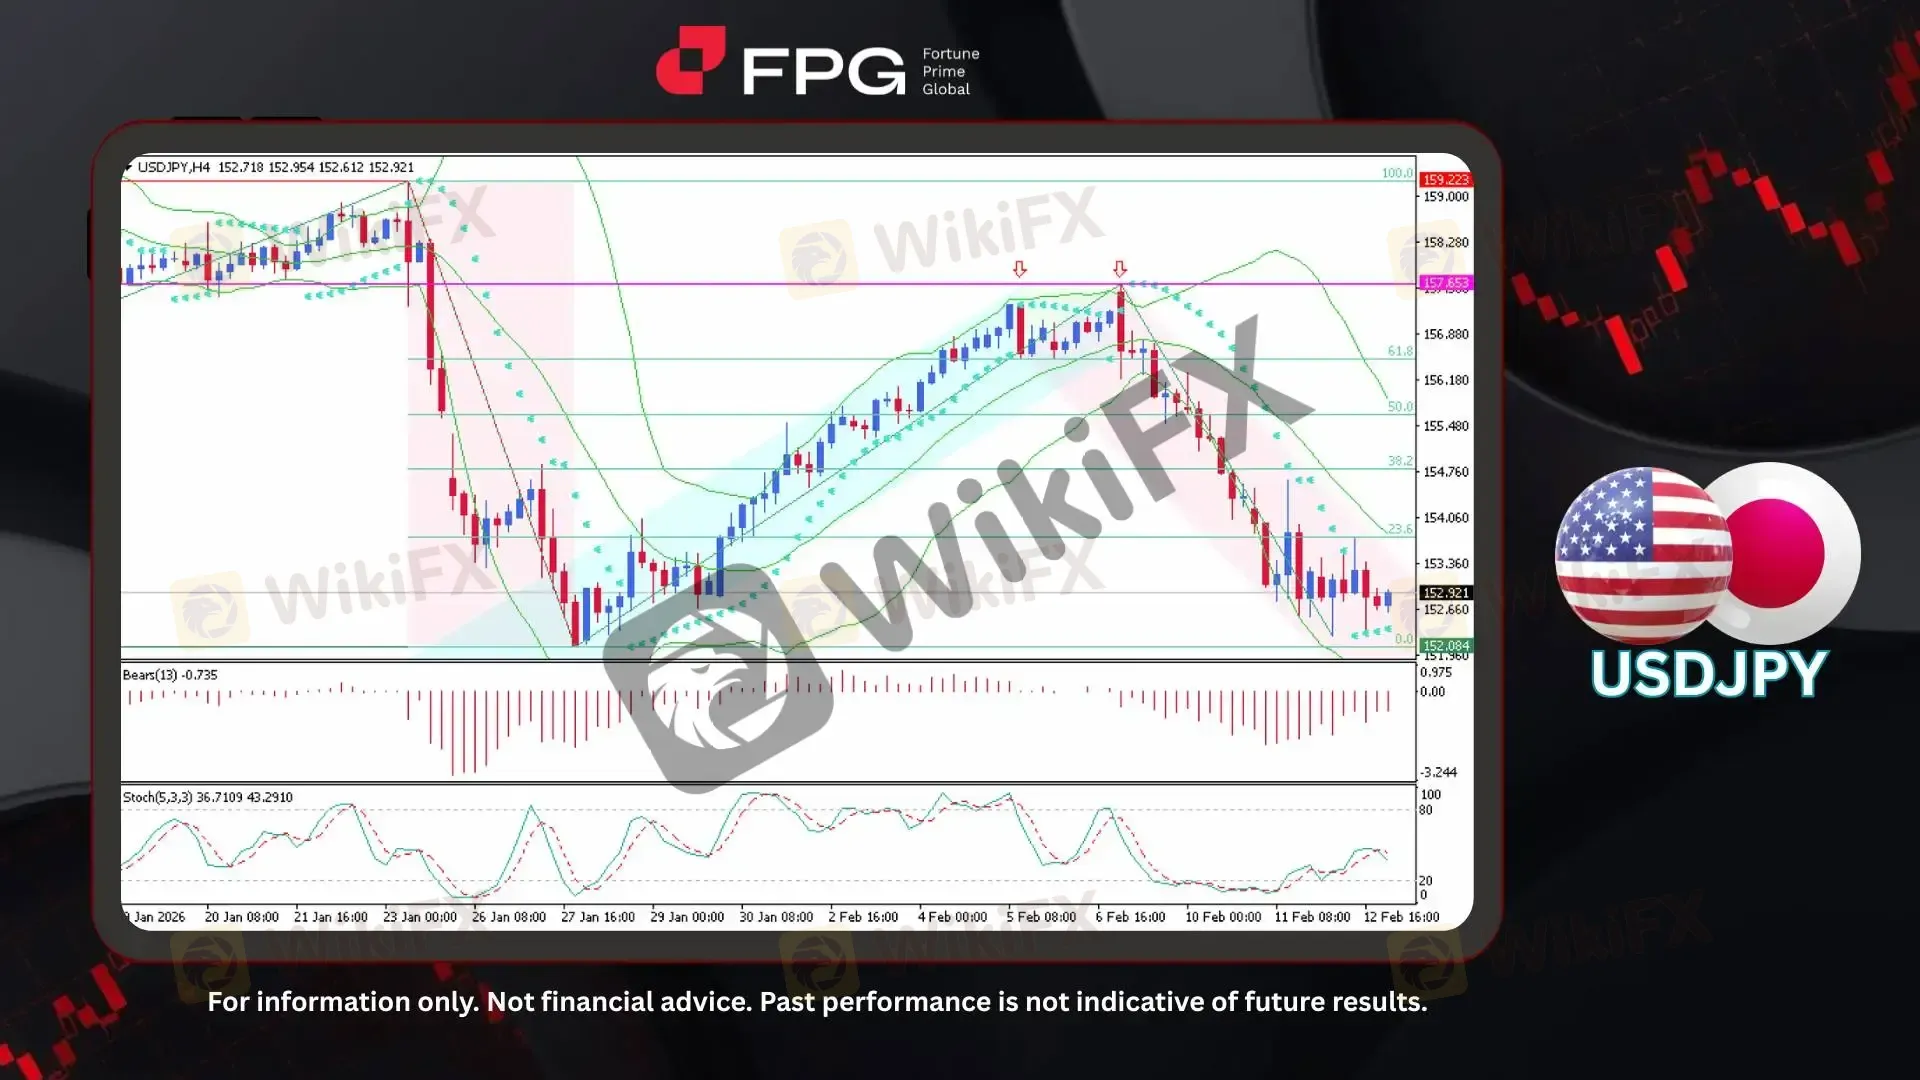
On the H4 timeframe, USDJPY previously experienced a sharp decline from 159.22 down to 152.08, reflecting strong bearish pressure in the market. After reaching that low, price staged a bullish rebound toward 157.65. However, at this resistance level, two consecutive rejections were formed, signaling exhaustion of buying momentum and triggering a reversal back into a bearish phase. Currently, price is trading around 152.92 and remains confined within a clear bearish channel structure, indicating that downside pressure is still dominant unless a strong breakout occurs above the channel resistance.
From a technical indicator perspective, price remains within a well-defined bearish channel following a strong rejection near the 157.65 resistance level. The Bollinger Bands have expanded during the recent decline, with price currently hovering near the lower band, indicating sustained downside pressure but also signaling potential short-term consolidation due to proximity to the volatility extreme. The Bears Power histogram remains in negative territory (around -0.735), reflecting continued seller dominance, although the bars show slight contraction, suggesting weakening bearish momentum compared to the initial sell-off phase. Meanwhile, the Stochastic (5,3,3) is positioned in the lower-mid range (approximately 36/43), not yet in deep oversold territory, implying that downside room still exists, but with early signs of momentum stabilization rather than immediate bullish reversal.
Fundamentally, USDJPY is heavily influenced by the divergence in monetary policy between the Federal Reserve and the Bank of Japan. Differences in interest rate direction, inflation data, employment figures, and GDP growth from both the United States and Japan play a significant role in driving volatility. Any shifts in expectations regarding Federal Reserve rate policy or adjustments in the Bank of Japan‘s yield curve control stance could lead to significant price fluctuations. Traders should remain alert to potential volatility during today’s economic data releases and press conferences, as USDJPY is particularly sensitive to macroeconomic surprises.
Market Observation & Strategy Advice
1. Current Position: USDJPY is trading around 152.92 within a well-defined bearish channel after a strong rejection near 157.65, maintaining a lower-high & lower-low structure that reflects sustained downside pressure.
2. Resistance Zone: Immediate resistance stands at 153.60–154.00, with the key resistance at 157.65 where the prior double rejection confirmed the bearish reversal.
3. Support Zone: Nearest support is located at 152.00–152.10, and a confirmed break below this area could expose the next downside target near 151.50.
4. Indicator Observation: Bollinger Bands are expanding with price near the lower band, Bears Power remains negative, and Stochastic sits in the lower-mid range, collectively signaling ongoing bearish bias without deep oversold conditions.
5. Trading Strategy Suggestions:
Pullback Short Strategy: Favor short positions on retracements toward resistance, provided confirmation signals support continued bearish momentum.
Bearish Breakout Scenario: A decisive breakdown below 152.00 may accelerate downside pressure and extend the bearish move.
Bullish Invalidation Level: A sustained break above 154.06 could weaken the current bearish structure and shift the bias toward consolidation.
Market Performance:
Forex Last Price % Change
EUR/USD 1.1867 −0.02%
GBP/USD 1.3615 −0.03%
Todays Key Economic Calendar:
US: Fed Miran Speech
CN: House Price Index YoY
DE: Wholesale Prices MoM & YoY
CN: New Yuan Loans
EU: Balance of Trade
EU: Employment Change QoQ & YoY Preliminary
US: Core Inflation Rate MoM & YoY
US: CPI
US: Inflation Rate MoM & YoY
Risk Disclaimer: This report is for informational purposes only and does not constitute financial advice. Investments involve risks, and past performance does not guarantee future results. Consult your financial advisor for personalized investment strategies.
Disclaimer:
Le opinioni di questo articolo rappresentano solo le opinioni personali dell’autore e non costituiscono consulenza in materia di investimenti per questa piattaforma. La piattaforma non garantisce l’accuratezza, la completezza e la tempestività delle informazioni relative all’articolo, né è responsabile delle perdite causate dall’uso o dall’affidamento delle informazioni relative all’articolo.
WikiFX Trader
WikiFX Trader
Rate Calc
USD

CNY
Tasso di cambio attuale:0
inserisci l'importo
USD
A disposizione
CNY
Calcolare 