
Broker Globale Piattaforma di Verifica Regolamentare
WikiFX
English
简体中文
繁體中文
English
Pусский
日本語
ภาษาไทย
Tiếng Việt
Bahasa Indonesia
Español
हिन्दी
Filippiiniläinen
Français
Deutsch
Português
Türkçe
한국어
العربية
FPG USDJPY Market Report January 16, 2026
Sommario:On the USDJPY M30 timeframe, after previously experiencing a sharp price drop from 159.34 to 158.08, the pair then began a gradual recovery as selling pressure diminished. This rebound has developed w
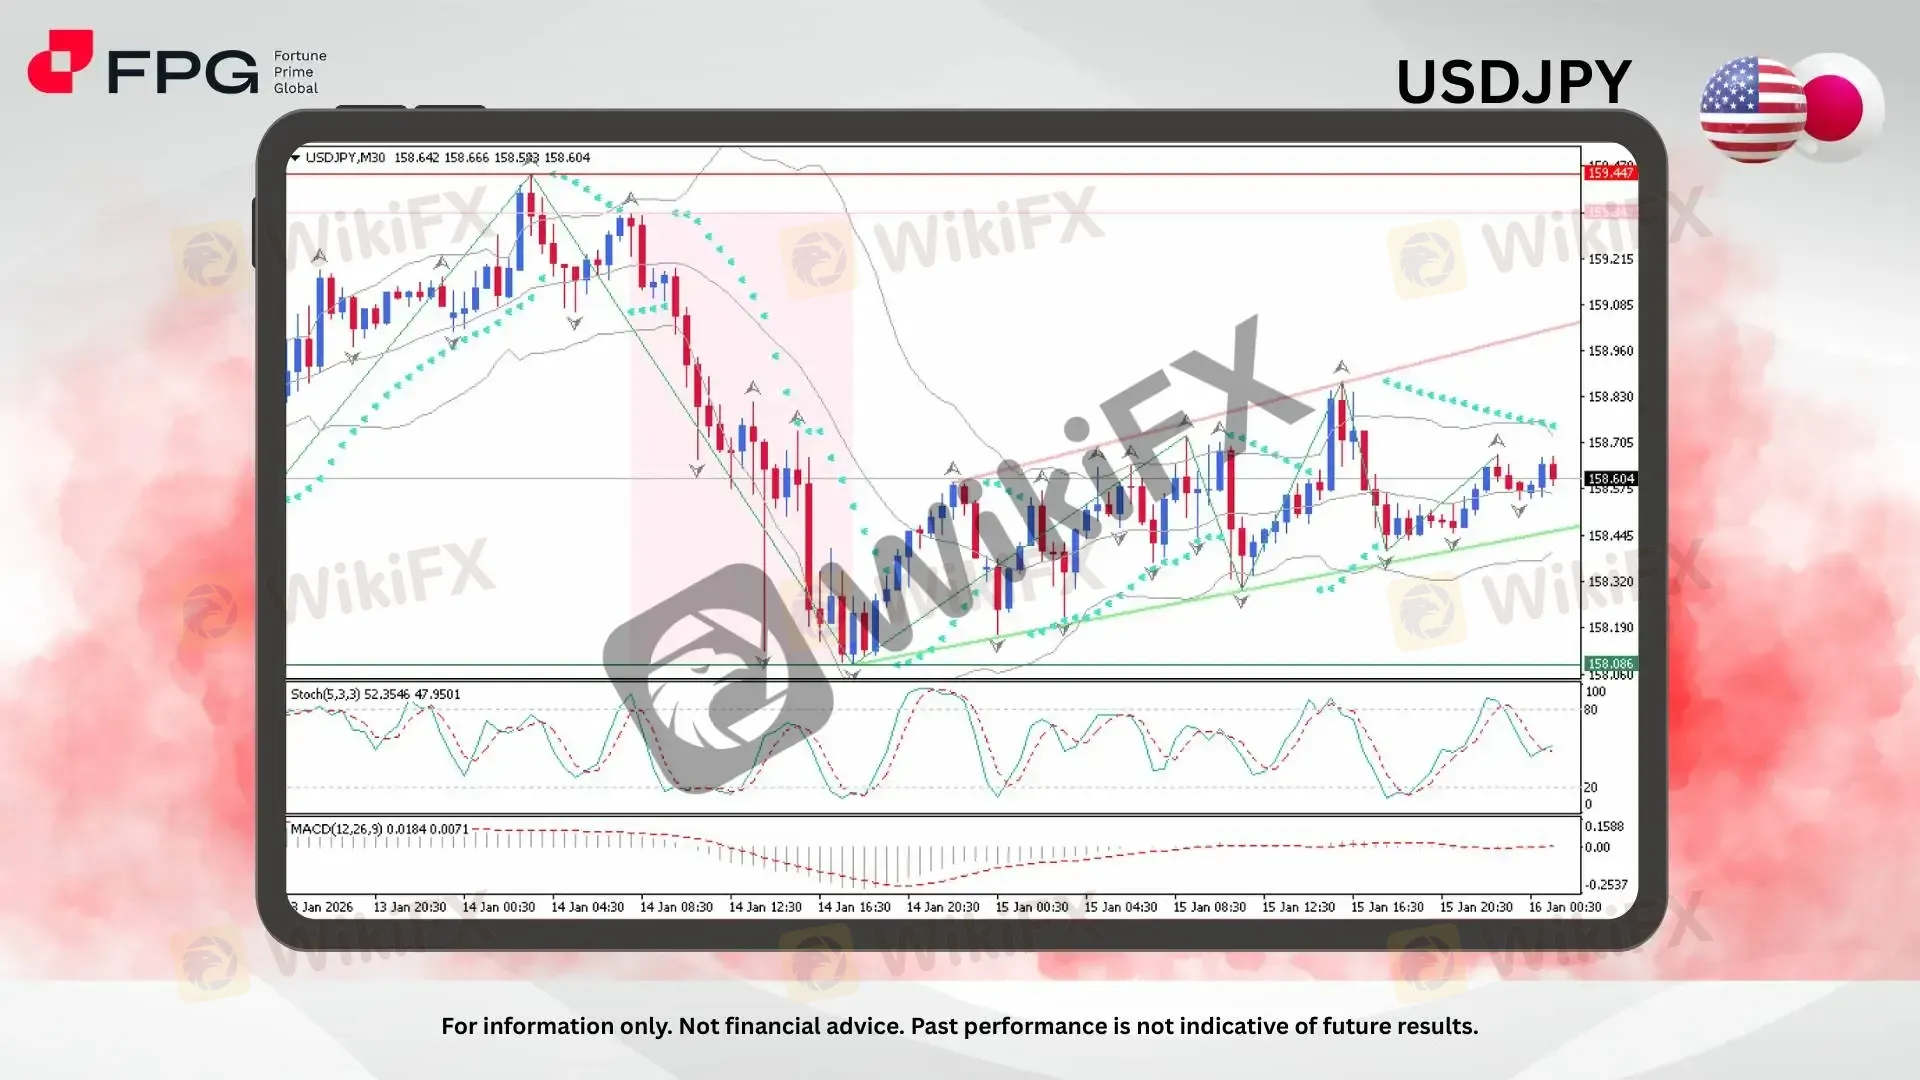
On the USDJPY M30 timeframe, after previously experiencing a sharp price drop from 159.34 to 158.08, the pair then began a gradual recovery as selling pressure diminished. This rebound has developed within a gentle bullish channel, suggesting a corrective recovery rather than a strong trend reversal at this stage. Price action shows higher lows forming consistently, indicating improving short-term sentiment. The current price is trading around 158.60, with volatility remaining moderate as the market consolidates and awaits a clearer directional catalyst.
From a technical indicator perspective, momentum on the USDJPY M30 chart appears neutral to mildly constructive. The Stochastic Oscillator is fluctuating around the mid-range, indicating balanced momentum without extreme overbought or oversold conditions, while its recent downward turn suggests short-term consolidation rather than strong directional follow-through. The MACD histogram remains near the zero line but is gradually flattening, signaling that bearish momentum is fading and downside pressure is weakening. Meanwhile, price continues to trade close to the middle of the Bollinger Bands, reflecting stable volatility and a market that is currently range-bound within its short-term bullish channel.
Fundamentally, USDJPY remains highly sensitive to global risk sentiment and the interest rate differential between the US and Japan. Ongoing expectations of prolonged elevated US interest rates continue to provide support for USD strength, while the Bank of Japans accommodative monetary stance caps JPY appreciation. In the short term, fluctuations in US bond yields, equity market performance, and broader risk appetite are likely to remain key drivers influencing intraday movements in this pair.
Market Observation & Strategy Advice
1. Current Position: USDJPY on the M30 timeframe is trading around 158.60, moving within a gentle bullish channel after rebounding from the 158.08 low. Price action remains orderly with moderate volatility, indicating a short-term recovery phase rather than a strong impulsive move.
2. Resistance Zone: The nearest resistance is located around 158.80–159.00, aligned with recent intraday highs and the upper boundary of the bullish channel. A stronger resistance area is seen near 159.30–159.45, where previous selling pressure emerged.
3. Support Zone: Immediate support is found around 158.40–158.30, near the rising channel support. A deeper support zone sits at 158.10–158.00, which marks the recent swing low and a key demand area.
4. Indicators: Momentum indicators reflect a neutral-to-slightly bullish bias. MACD is gradually improving and edging toward positive territory, indicating strengthening bullish momentum, though still relatively modest.
5. Trading Strategy Suggestions:
Buy on Dips: Look for buying opportunities near the 158.45 support zone while price remains inside the bullish channel.
Sell near Resistance: Consider short-term sell setups around 158.80–159.00 if bullish momentum shows signs of weakening.
Wait for Breakout: A confirmed break above 159.00 may open room for continuation toward the 159.30–159.45 area, while a break below 158.00 would invalidate the bullish recovery scenario.
Market Performance:
Forex Last Price % Change
EUR/USD 1.1608 +0.01%
GBP/USD 1.3381 +0.04%
Today's Key Economic Calendar:
US: Fed Barkin Speech
US: Net Long-term TIC Flows
CA: Housing Starts
US: Industrial Production MoM
US: NAHB Housing Market Index
US: Fed Bowman Speech
RU: Inflation Rate MoM & YoY
Risk Disclaimer: This report is for informational purposes only and does not constitute financial advice. Investments involve risks, and past performance does not guarantee future results. Consult your financial advisor for personalized investment strategies.
Disclaimer:
Le opinioni di questo articolo rappresentano solo le opinioni personali dell’autore e non costituiscono consulenza in materia di investimenti per questa piattaforma. La piattaforma non garantisce l’accuratezza, la completezza e la tempestività delle informazioni relative all’articolo, né è responsabile delle perdite causate dall’uso o dall’affidamento delle informazioni relative all’articolo.
WikiFX Trader
Rate Calc
USD

CNY
Tasso di cambio attuale:0
inserisci l'importo
USD
A disposizione
CNY
Calcolare 