
Broker Globale Piattaforma di Verifica Regolamentare
WikiFX
English
简体中文
繁體中文
English
Pусский
日本語
ภาษาไทย
Tiếng Việt
Bahasa Indonesia
Español
हिन्दी
Filippiiniläinen
Français
Deutsch
Português
Türkçe
한국어
العربية
FPG EURUSD Market Report January 15, 2026
Sommario:This technical analysis on the EURUSD M30 timeframe focuses on short-term price action for intraday or swing traders. As shown on the chart, the pair previously staged a strong bullish rally from the
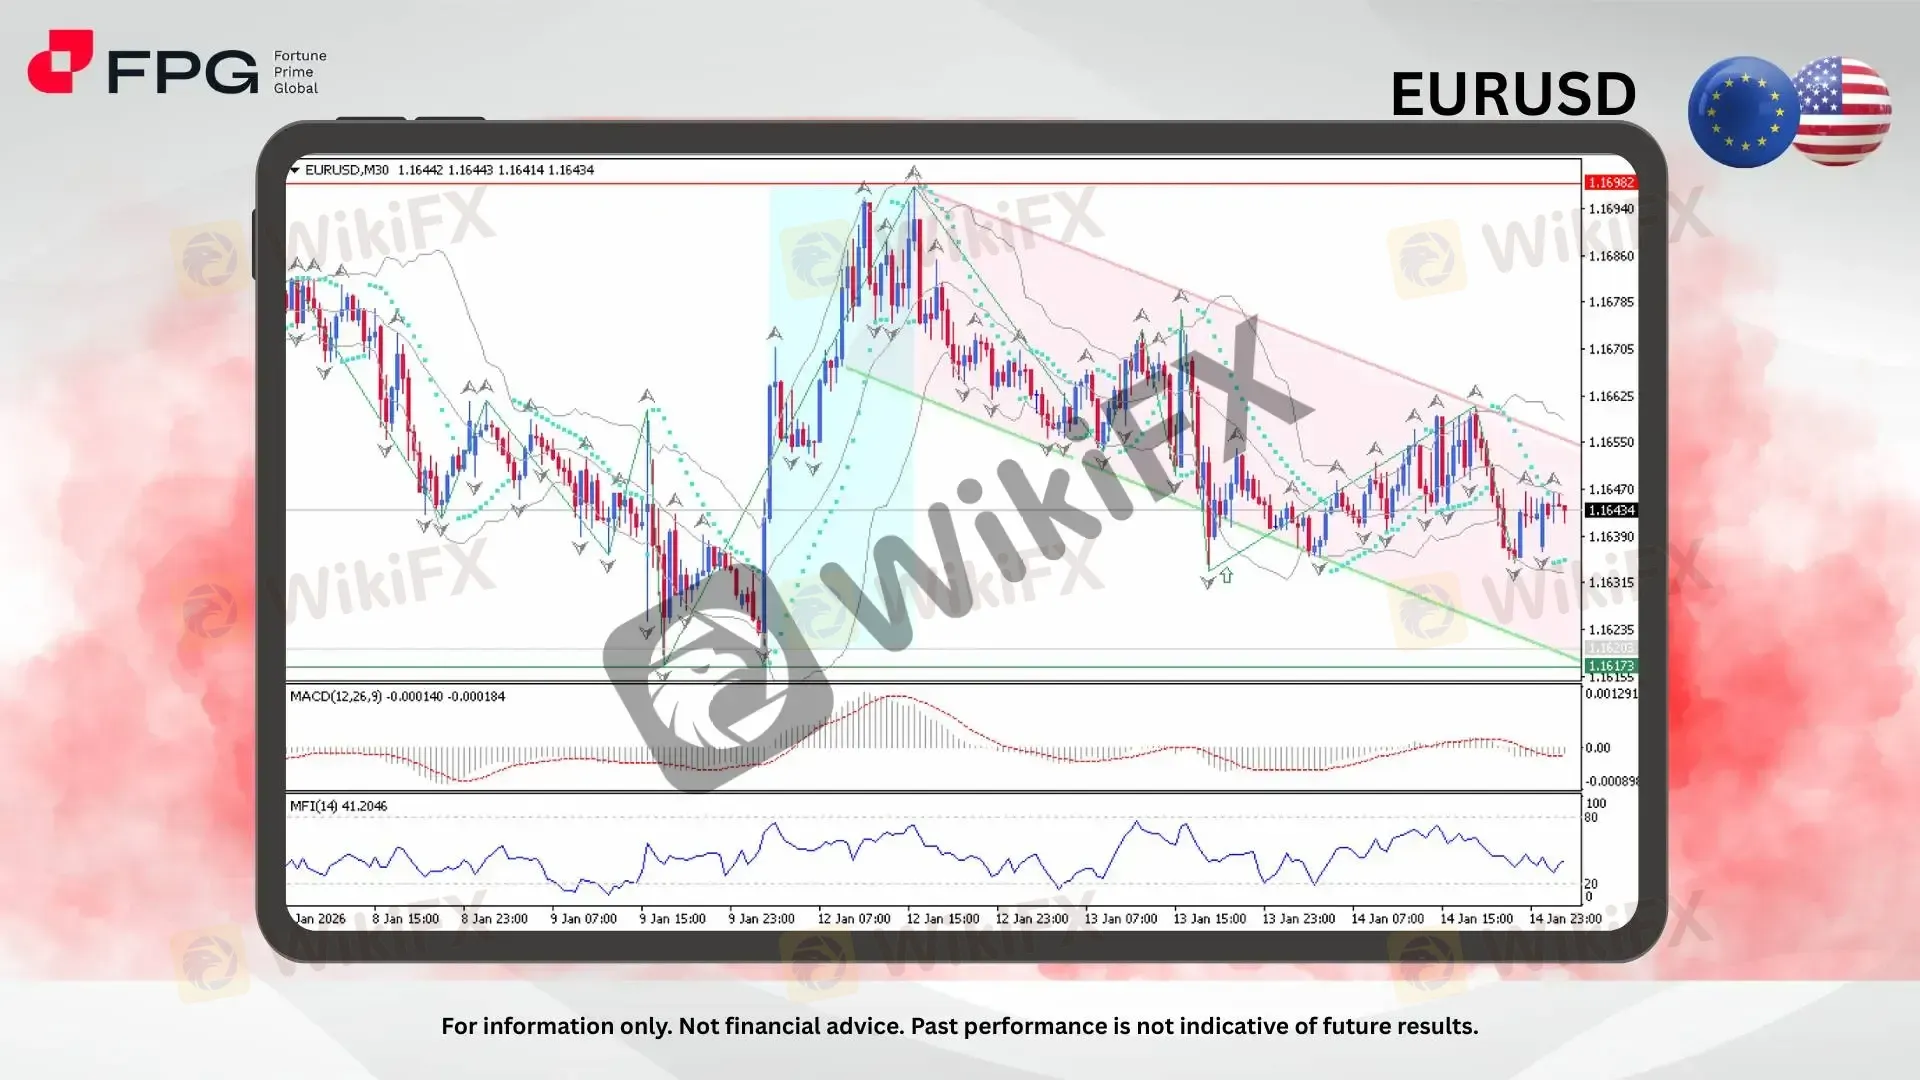
This technical analysis on the EURUSD M30 timeframe focuses on short-term price action for intraday or swing traders. As shown on the chart, the pair previously staged a strong bullish rally from the 1.1620 area to a peak near 1.1698. However, that high was firmly rejected, triggering a clear trend reversal to the downside. This reversal established a moderate bearish channel, highlighted by the descending diagonal resistance. Although the price briefly broke below the channels lower boundary, it failed to sustain the breakdown and moved back inside the channel. Currently, EURUSD is trading around 1.1643 and remains confined within this descending structure, suggesting ongoing bearish pressure with intermittent corrective rebounds.
From an indicator perspective, the Bollinger Bands show the price oscillating near the middle-to-lower band, indicating reduced bullish momentum and a market leaning bearish, but not yet in an extreme condition. The Parabolic SAR dots are mostly positioned above the candles, reinforcing the prevailing downside bias on this timeframe. The MACD remains below the zero line with a relatively flat histogram, signaling weak bearish momentum and a lack of strong directional conviction, which aligns with the choppy movement inside the channel. Meanwhile, the MFI (14) is around the low-40 area, suggesting neutral to slightly bearish money flow, with no clear signs of strong accumulation from buyers at this stage.
Beyond technical factors, EURUSD movements continue to be heavily influenced by fundamental dynamics between the European Union and the United States. Ongoing geopolitical developments and reciprocal statements from policymakers have contributed to elevated intraday volatility. As a result, price fluctuations within the bearish channel may intensify around major economic releases or official comments. Traders are advised to stay vigilant during todays key events, as sudden volatility spikes could trigger false breakouts or sharp reactions near channel support and resistance levels.
Market Observation & Strategy Advice
1. Current Position: EURUSD is trading around 1.1643 within a descending bearish channel after rejection from the 1.1698 high. The short-term bias remains mildly bearish with price consolidating inside the channel.
2. Resistance Zone: Immediate resistance stands at 1.1655 – 1.1662 along the channel top, with a stronger cap at 1.1690 – 1.1698, the previous reversal zone.
3. Support Zone: Nearest support is located at 1.1630 – 1.1620, followed by a stronger support area around 1.1617.
4. Indicators: The Bollinger Bands suggest price is trading near the mid-to-lower band, reflecting limited upside momentum. Most Parabolic SAR remains above price, supporting a bearish bias. MACD is below the zero line with a weak histogram, signaling subdued bearish momentum and potential range behavior. MFI (14) around the low-40 level indicates neutral to slightly bearish money flow, with no clear accumulation signal yet.
5. Trading Strategy Suggestions:
Sell on Rallies: Look for short entries near the upper channel resistance with targets toward lower support levels.
Breakout Watch: Consider selling if price breaks and closes below 1.1617, confirming bearish continuation.
Trend Reassessment: Reevaluate bullish opportunities if price breaks and holds above the channel, signaling potential trend reversal.
Market Performance:
Forex Last Price % Change
USD/JPY 158.50 +0.05%
GBP/USD 1.3431 −0.05%
Today's Key Economic Calendar:
US: Fed Bostic, Kashkari, & Williams Speeches
UK: RICS House Price Balance
UK: GDP 3–Month Avg
UK: GDP MoM
UK: Goods Trade Balance & Goods Trade Balance Non-EU
UK: Industrial Production MoM
UK: Manufacturing Production MoM
DE: Wholesale Prices MoM & YoY
EU: ECB Economic Bulletin
DE: Full Year GDP Growth
CN: New Yuan Loans
EU: Balance of Trade
EU: Industrial Production MoM
US: Exports Prices & Imports Prices MoM
US: Initial Jobless Claims
US: NY Empire State Manufacturing Index
US: Philadelphia Fed Manufacturing Index
US: Fed Bostic & Barr Speeches
Risk Disclaimer: This report is for informational purposes only and does not constitute financial advice. Investments involve risks, and past performance does not guarantee future results. Consult your financial advisor for personalized investment strategies.
Disclaimer:
Le opinioni di questo articolo rappresentano solo le opinioni personali dell’autore e non costituiscono consulenza in materia di investimenti per questa piattaforma. La piattaforma non garantisce l’accuratezza, la completezza e la tempestività delle informazioni relative all’articolo, né è responsabile delle perdite causate dall’uso o dall’affidamento delle informazioni relative all’articolo.
WikiFX Trader
WikiFX Trader
Rate Calc
USD

CNY
Tasso di cambio attuale:0
inserisci l'importo
USD
A disposizione
CNY
Calcolare 