
Broker Globale Piattaforma di Verifica Regolamentare
WikiFX
English
简体中文
繁體中文
English
Pусский
日本語
ภาษาไทย
Tiếng Việt
Bahasa Indonesia
Español
हिन्दी
Filippiiniläinen
Français
Deutsch
Português
Türkçe
한국어
العربية
FPG USDJPY Market Report January 9, 2026
Sommario:On the USDJPY H1 chart, a sharp bearish move was recorded in early January, where price dropped aggressively from the 157.29 high down to the 156.10 area within a single trading day, signaling strong
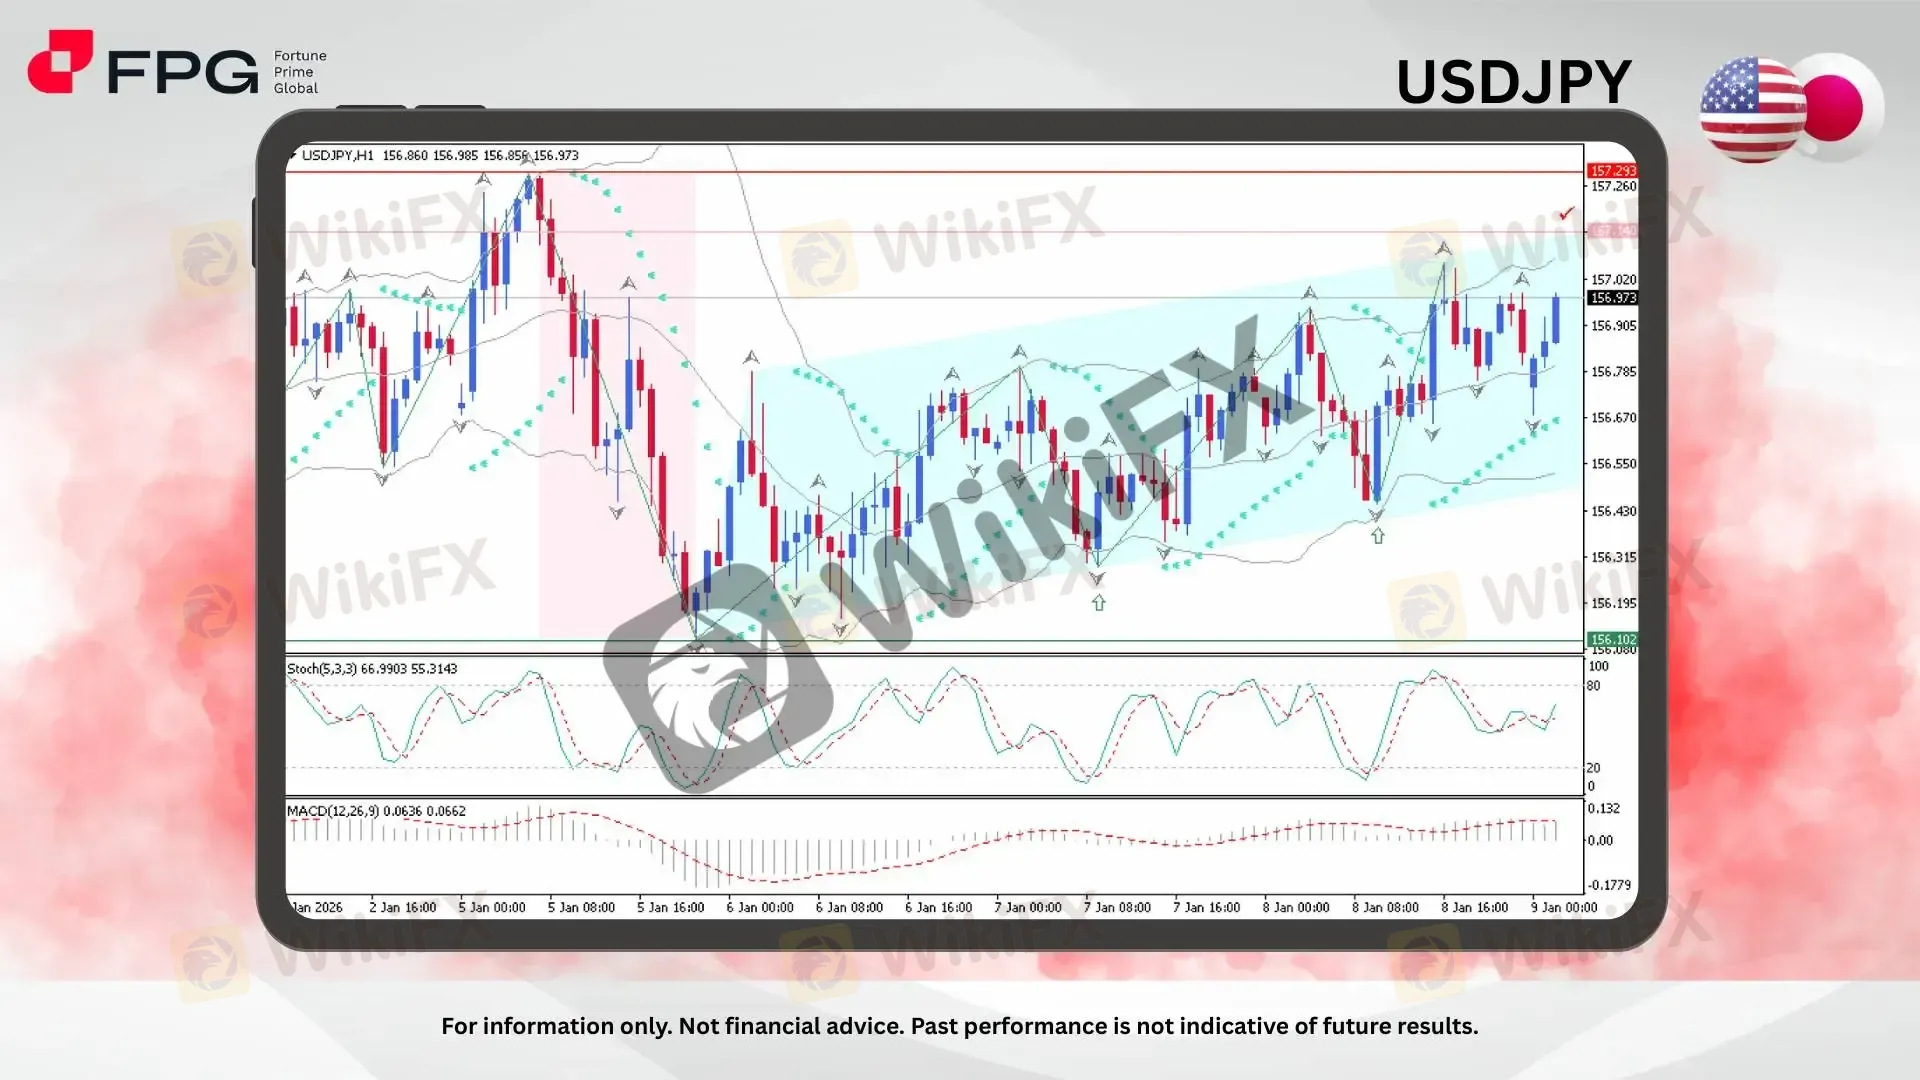
On the USDJPY H1 chart, a sharp bearish move was recorded in early January, where price dropped aggressively from the 157.29 high down to the 156.10 area within a single trading day, signaling strong short-term selling pressure. From that low, price staged a steady corrective rebound and began moving within a clearly defined bullish channel, forming higher lows and gradual higher highs. Currently, USDJPY is trading around 156.97 and remains volatile as it approaches the channels diagonal resistance, with the 157.14 zone standing out as the next key area that could determine whether the recovery extends or stalls.
Technically, the recovery structure remains constructive but still corrective in nature when viewed against the broader price rejection from the 157.29 peak. Price action continues to respect the ascending channel, with multiple successful reactions from the lower channel boundary, indicating that buyers are still active on dips. However, repeated hesitation near the upper channel area suggests diminishing upside momentum as price approaches resistance. From the indicator side, Stochastic Oscillator (5,3,3) is currently fluctuating in the upper-mid range, reflecting bullish momentum that is present but no longer aggressive, and showing early signs of consolidation rather than expansion. MACD (12,26,9) remains above the zero line with a positive histogram, confirming bullish momentum, although the flattening histogram bars suggest that upside momentum may be stabilizing rather than accelerating. This combination points to a market that is still biased higher, but increasingly sensitive to resistance reactions.
From a broader perspective, this corrective rebound appears to be part of the market‘s ongoing adjustment to geopolitical tensions involving the U.S. and the global environment, which have recently driven volatility. USDJPY remains highly sensitive to shifts in risk sentiment and U.S. macro expectations, particularly interest rate outlooks. Traders should remain alert to today’s key economic data releases and official statements, as fresh catalysts could either reinforce the current recovery or trigger renewed downside pressure if risk-off sentiment resurfaces.
Market Observation & Strategy Advice
1. Current Position: USDJPY is trading around 156.97, holding above the midline of the bullish channel.
2. Resistance Zone: Immediate resistance is located at 157.14, followed by the major rejection high near 157.29.
3. Support Zone: Key support lies at 156.55–156.43, aligned with the lower channel boundary and prior rebound points.
4. Indicators: Stochastic Oscillator (5,3,3) is elevated but no longer expanding, while MACD remains positive with slowing momentum. As long as price remains inside the bullish channel, short-term bias stays positive, but upside potential weakens near resistance.
5. Trading Strategy Suggestions:
Buy-on-dip scenario: Consider long positions near the 156.55–156.43 support zone, targeting 157.14.
Resistance reaction trade: Watch for bearish rejection signals near 157.14–157.29 for potential short-term pullbacks.
Invalidation level: A sustained break below 156.10 would invalidate the bullish channel and shift bias back to bearish.
Market Performance:
Forex Last Price % Change
EUR/USD 1.1655 −0.04%
GBP/USD 1.3432 −0.02%
Today's Key Economic Calendar:
JP: Household Spending MoM & YoY
CN: Inflation Rate MoM & YoY
CN: PPI YoY
DE: Balance of Trade
EU: Retail Sales MoM
US: Average Hourly Earning MoM & YoY
US: Building Permits Prel
CA: Employment Change
US: Housing Starts
US: Nonfarm Payrolls
US: Participation Rate
US: Unemployment Rate
US: Fed Kashkari Speech
US: Michigan Consumer Sentiment Prel
Risk Disclaimer: This report is for informational purposes only and does not constitute financial advice. Investments involve risks, and past performance does not guarantee future results. Consult your financial advisor for personalized investment strategies.
Disclaimer:
Le opinioni di questo articolo rappresentano solo le opinioni personali dell’autore e non costituiscono consulenza in materia di investimenti per questa piattaforma. La piattaforma non garantisce l’accuratezza, la completezza e la tempestività delle informazioni relative all’articolo, né è responsabile delle perdite causate dall’uso o dall’affidamento delle informazioni relative all’articolo.
WikiFX Trader
STARTRADER
Sotto supervisione
VT Markets
Sotto supervisione
FXCM
Sotto supervisione
D prime
Supervisione del paese
HFM
Sotto supervisione
FXTM
Sotto supervisione
STARTRADER
Sotto supervisione
VT Markets
Sotto supervisione
FXCM
Sotto supervisione
D prime
Supervisione del paese
HFM
Sotto supervisione
FXTM
Sotto supervisione
Rate Calc
USD

CNY
Tasso di cambio attuale:0
inserisci l'importo
USD
A disposizione
CNY
Calcolare 