
Applicazione di richiesta di informazioni sulla regolamentazione dei broker globali
WikiFX
English
简体中文
繁體中文
English
Pусский
日本語
ภาษาไทย
Tiếng Việt
Bahasa Indonesia
Español
हिन्दी
Filippiiniläinen
Français
Deutsch
Português
Türkçe
한국어
العربية
FPG EURUSD Market Report December 11, 2025
Sommario:On the EURUSD H1 chart, price has just experienced a strong bullish surge, jumping from 1.1627 to 1.1704. After moving within a slight bearish channel for several sessions, the pair finally broke abov
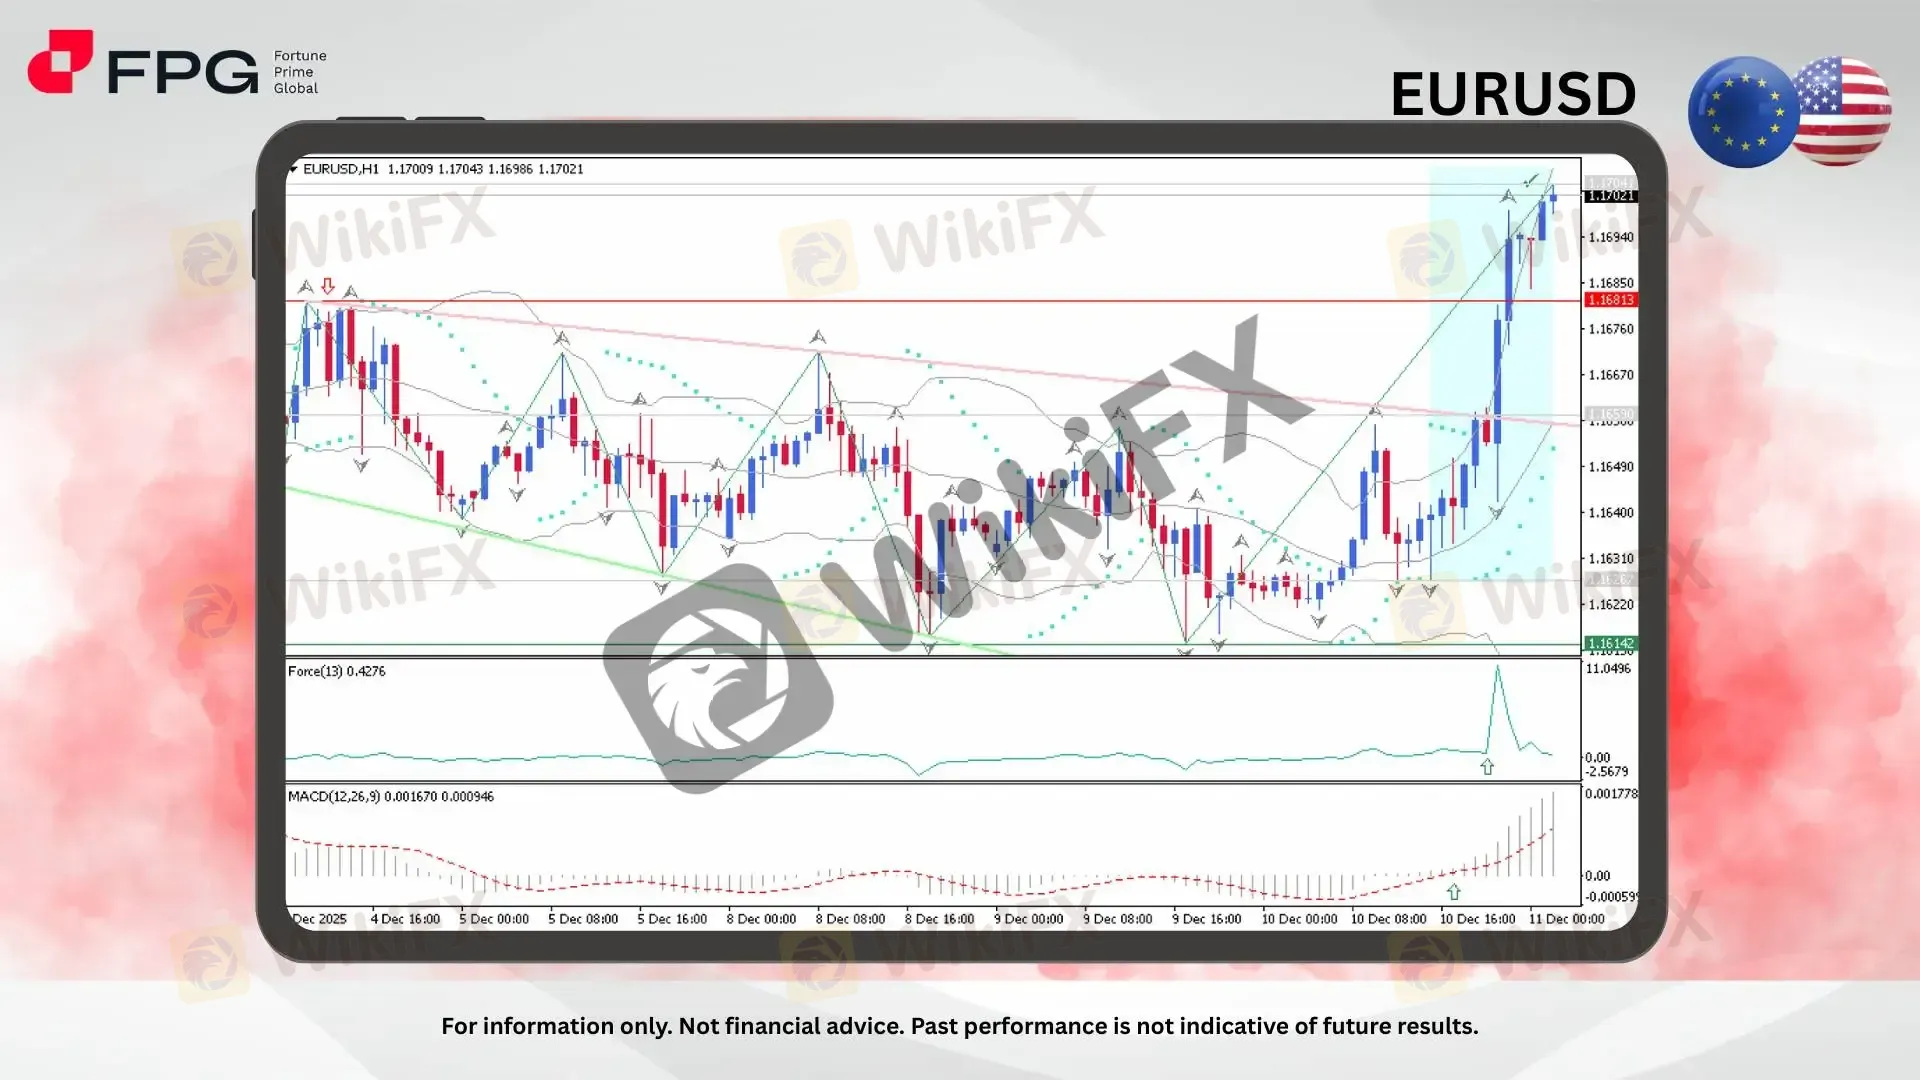
On the EURUSD H1 chart, price has just experienced a strong bullish surge, jumping from 1.1627 to 1.1704. After moving within a slight bearish channel for several sessions, the pair finally broke above the channels diagonal resistance near 1.1659, followed by a clean continuation breakout past the next key resistance at 1.1681. The current price is hovering around 1.1702, still showing aggressive momentum and heightened volatility. On a broader timeframe, the next resistance to watch sits near 1.1727.
Technical indicators show strong bullish confirmation. The Parabolic SAR dots have shifted below price, signaling a clear transition into upward momentum. Bollinger Bands are expanding with candles riding the upper band, indicating increasing volatility and strong directional pressure. The Force Index displays a sharp spike, reflecting intensified buying volume behind the latest rally. Meanwhile, MACD histogram bars are rising steadily with widening separation between the MACD line and signal line, reinforcing that bullish momentum is strengthening and not yet showing signs of exhaustion.
This sharp upward movement is likely driven by fundamental catalysts, specifically the US dollar‘s decline following the recent Fed rate cut and dovish remarks by Jerome Powell. Softer USD sentiment boosted major currencies across the board, and EURUSD’s technical structure aligned with the macro momentum, triggering the breakout rally visible on the chart.
Market Observation & Strategy Advice
1. Current Position: EURUSD on the H1 timeframe is currently trading around 1.1702 after a sharp bullish breakout from the previous bearish channel. The pair has shown strong upward momentum, driven both by technical breakout structure and increased volatility.
2. Resistance Zone: The immediate resistance is located near 1.1727, which aligns with the next significant barrier seen on the higher timeframe. A sustained push above this level may open the path toward further bullish continuation.
3. Support Zone: The nearest support sits around 1.1681, the previous breakout level that now acts as a critical area. A deeper support area lies near 1.1659, the former diagonal channel resistance that has turned into a secondary support zone.
4. Indicators: Parabolic SAR dots have shifted beneath price, indicating strong bullish momentum. Bollinger Bands are expanding, reflecting heightened volatility with candles hugging the upper band. The Force Index shows a notable spike, revealing strengthened buying pressure. MACD histogram bars continue rising with widening separation between the MACD and signal line, confirming sustained bullish momentum with no immediate signs of reversal.
5. Trading Strategy Suggestions:
Bullish Bias: Look for potential buy opportunities on pullbacks toward 1.1681 or 1.1659, with upside targets at 1.1727. Traders can consider maintaining momentum-based positions while indicators remain supportive.
Bearish Setup: Conservative sellers should wait for clear bearish rejection patterns at 1.1727 before considering countertrend positions.
Risk Management: Elevated volatility requires tighter monitoring of positions. Avoid overexposure during major US news releases, as the recent move was heavily influenced by USD weakness following the Fed rate cut and Powells dovish tone.
Market Performance:
Forex Last Price % Change
USD/JPY 155.65 −0.23%
GBP/USD 1.3385 +0.03%
Today's Key Economic Calendar:
US: Fed Interest Rate Decision
US: FOMC Economic Projections
US: Fed Press Conference
UK: RICS House Price Balance
AU: Employment Change & Full Time Employment Change
AU: Unemployment Rate
CA: Balance of Trade
US: Balance of Trade
US: Exports & Imports
US: Initial Jobless Claims
Risk Disclaimer: This report is for informational purposes only and does not constitute financial advice. Investments involve risks, and past performance does not guarantee future results. Consult your financial advisor for personalized investment strategies.
Disclaimer:
Le opinioni di questo articolo rappresentano solo le opinioni personali dell’autore e non costituiscono consulenza in materia di investimenti per questa piattaforma. La piattaforma non garantisce l’accuratezza, la completezza e la tempestività delle informazioni relative all’articolo, né è responsabile delle perdite causate dall’uso o dall’affidamento delle informazioni relative all’articolo.
WikiFX Trader
EBC
Sotto supervisione
JustMarkets
Sotto supervisione
IC Markets Global
Sotto supervisione
Exness
Sotto supervisione
HFM
Sotto supervisione
FXTM
Sotto supervisione
EBC
Sotto supervisione
JustMarkets
Sotto supervisione
IC Markets Global
Sotto supervisione
Exness
Sotto supervisione
HFM
Sotto supervisione
FXTM
Sotto supervisione
Rate Calc
USD

CNY
Tasso di cambio attuale: 0
inserisci l'importo
USD
A disposizione
CNY
Calcolare