
Global Broker Regulation Inquiry App
WikiFX
English
简体中文
繁體中文
English
Pусский
日本語
ภาษาไทย
Tiếng Việt
Bahasa Indonesia
Español
हिन्दी
Filippiiniläinen
Français
Deutsch
Português
Türkçe
한국어
العربية
Broadcom Plunge Triggers Wall Street Selloff in AI Stocks
Abstract:Last Friday (12th), U.S. equities suffered a sharp selloff, led by technology growth stocks and a steep decline in the Philadelphia Semiconductor Index. The move reflected mounting concerns over stret
Last Friday (12th), U.S. equities suffered a sharp selloff, led by technology growth stocks and a steep decline in the Philadelphia Semiconductor Index. The move reflected mounting concerns over stretched valuations and potential bubble risks within the AI sector, triggering a wave of concentrated profit-taking.
The selling pressure was heavily concentrated in technology growth stocks and AI-related names, sparked by negative developments from two major industry players.
Broadcom (AVGO) Shares Collapse
Broadcom shares plunged despite the company reporting earnings that exceeded expectations and strong growth in AI-related chip revenue. However, management‘s forward-looking sales commentary during the earnings call failed to meet Wall Street’s elevated expectations.
In addition, Broadcom highlighted margin pressure within its AI business, raising concerns over whether aggressive AI investment can sustainably translate into robust profitability. This commentary dealt a significant blow to market sentiment, with Broadcom shares falling more than 10% on the day and dragging down the broader semiconductor and AI complex.
Oracle (ORCL) Extends Its Decline
Oracle shares continued to slide after the company reported weaker-than-expected quarterly sales earlier in the week and issued disappointing guidance, signaling higher future spending.
More notably, reports suggesting delays in the completion of certain data centers being built for OpenAI intensified market concerns over Oracle‘s AI infrastructure investments and execution capabilities. As a result, Oracle’s stock suffered multiple consecutive days of sharp declines.
We view this selloff not as a systemic market collapse, but rather as a self-correction following the earlier AI-driven rally. After leading companies delivered outlooks that fell short of lofty expectations, Wall Street opted to aggressively reduce exposure to high-valuation, high-risk technology growth stocks in order to mitigate potential downside risks associated with a deflating AI bubble.
(Figure 2. Broadcom Market Capitalization Declines by USD 200 Billion)
From a broader AI ecosystem perspective, market focus has clearly shifted from innovation-led optimism to cost discipline and financial sustainability. After roughly three years of rapid AI development, business models and balance-sheet resilience have become the markets primary concerns. Winning in AI is no longer defined by model performance alone, but increasingly by data acquisition, infrastructure scalability, and talent integration. As AI applications move closer to commercialization, investor preferences have transitioned from “vision-driven storytelling” to survivability and execution.
Bonds Sold, Gold Shines as Safe Haven
Despite the equity market selloff and a weaker U.S. dollar index, traditional safe-haven U.S. Treasuries were also sold off, with the 10-year Treasury yield approaching the 4.2% level. In contrast, gold fully demonstrated its role as a capital safe haven, stabilizing above USD 4,300 per ounce.
Investors should not be puzzled by the apparent divergence where risk-free Treasuries are sold while gold prices rise. In simple terms, the 10-year Treasury yield primarily reflects long-term interest rate and inflation expectations, which are influenced by structural supply pressures. Gold prices, on the other hand, respond more directly to rising liquidity conditions and short-term market fear, driven by balance sheet expansion and heightened demand for hedging. The divergence between the two assets is therefore entirely rational.
Gold Technical Analysis
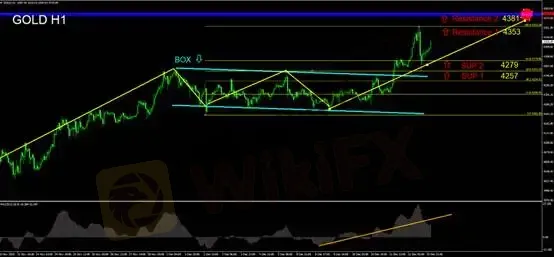
Gold prices have decisively broken above the blue consolidation range, and the current structure should be viewed as the second major leg of the ongoing uptrend.
For investors currently without positions, a buy-on-pullback strategy is recommended. Focus on the Fibonacci 38.2% support level at USD 4,279; a stabilization at this level would provide an opportunity to initiate long positions.
Suggested Stop Loss: USD 30
Support Levels
Support 1: 4,279
Support 2: 4,257
Resistance Levels
Resistance 1: 4,353
Resistance 2: 4,381
Risk Disclaimer
The views, analyses, research, prices, and other information provided above are for general market commentary only and do not represent the official position of this platform. All readers assume full responsibility for their own investment decisions and associated risks. Please trade with caution.
Disclaimer:
The views in this article only represent the author's personal views, and do not constitute investment advice on this platform. This platform does not guarantee the accuracy, completeness and timeliness of the information in the article, and will not be liable for any loss caused by the use of or reliance on the information in the article.
WikiFX Broker
Latest News
The "Broker Group" Abyss: How OmegaPro Trapped Thousands in a Digital Dead End
 WikiFX
FXORO Under the Microscope: Revoked Licenses and The "Advisory" Trap
WikiFXXXLMARKETS Review: Regulatory Status and Trading Conditions
WikiFXIUX Review 2025: Regulatory Status and Withdrawal Complaints
WikiFXSaxo Bank Review 2025: Regulatory Status and Safety Score
WikiFXAmariFX Review: Traders Annoyed by Slippage, Login & Withdrawal Issues
WikiFXLibertex Investigation: When "Expert Advice" Leads to Total Ruin
WikiFXEZINVEST Exposure: When a "Personal Advisor" Becomes Your Portfolio’s Worst Enemy
WikiFXDeriv Review: Is This Popular Broker Legit or Risky?
WikiFXIs CICC Broker Safe? CICC Regulation Check & In-Depth Review
WikiFXCurrency Calculator
USD

CNY
Current Rate: 0
Amount
USD
Available
CNY
Calculate