

Global Broker Regulation Inquiry App
About WikiFX
English
简体中文
繁體中文
English
Pусский
日本語
ภาษาไทย
Tiếng Việt
Bahasa Indonesia
Español
हिन्दी
Filippiiniläinen
Français
Deutsch
Português
Türkçe
한국어
العربية
اردو
Massive week for Silver. Santa rally in stocks?- Week 48| Technical Analysis by Jasper Lawler
Abstract:Week Ahead 📅 1–7 December, 2025After a massive rally and its highest weekly close on record, silver is possibly setting up for a long term breakout, maybe as soon as this week.Markets enter December
Week Ahead 📅 1–7 December, 2025
After a massive rally and its highest weekly close on record, silver is possibly setting up for a long term breakout, maybe as soon as this week.
Markets enter December after a volatile November handover. The dip in US indices has arguably increased the chances of a ‘Santa Rally’ or year-end sentiment might remain dampened by valuation risk and rate cut speculation.
Week in Review
💹 Price Action
• Nasdaq 100 fell ~5% on the week; strong earnings from Nvidia did not offset risk-off pressure tied to AI-valuation concerns.
• November performance divergence saw Europes Stoxx 600 record its 5th consecutive positive month.
• CME Group experienced a brief outage late last week, temporarily disrupting flows in energy, metals, FX, Treasuries, and U.S. equity futures pricing.
• Bitcoin halving commentary weighed on crypto sentiment amid expectations long-term holders may adjust exposure into year-end.
📰 Latest News
• Since July, private-sector hiring has slowed materially, adding only a net +10k jobs after +42k in October, with wage growth flat at 4.5% (job stayers) and 6.7% (job changers).
• Attention swung to December FOMC policy: Fed futures moved from unlikely toward ~83% implied cut probability for the coming meeting.
• UK October CPI cooled to 3.6% (core 3.4%), and retail sales disappointed, keeping distribution pressure elevated around services hiring decisions.
• The RBNZ delivered a 25bp rate cut with hawkish framing, noting an unchanged hold was also discussed, supporting the NZD/USD upside skew.
• Hardline geopolitical framing from Vladimir Putin influenced crude oil markets late last week, narrowing initial optimism tied to Ukraine peace-framework headlines.
Top Events & Data (1–7 December)
• UK Services PMI (Nov) – 3 Dec: flash 50.5 (7-month low). Rising caution ahead of budgets paused hiring and new-work decisions; first contraction in new work since July seen.
• ISM Services (Nov) – 3 Dec: flash 55, the highest since July, though employment slowed; input prices rose fastest since Jan 2023, complicating inflation descent narratives.
FYI Interest-Rate Decisions this Month (Before Holidays)
Interest-Rate Decisions (end-of-year meetings)
• Federal Reserve decision (10 Dec): expected to hold or deliver a close call even if payrolls surprise higher, given previous splits and blackout timing.
• European Central Bank (11 Dec): markets price no easing; steady stance viewed as supportive when inflation tracks target.
• Bank of England (18 Dec): markets price ~90% probability of a 25bp cut; sentiment depends on trust, fiscal clarity, and inflation mix.
• Swiss National Bank (11 Dec): scheduled.
• European Leaders Summit (19 Dec): risk-headline window for Europe.
Corporate Updates This Week
• CrowdStrike, Marvell, Salesforce, Kroger and Balfour Beatty.
Technical Analysis
We look at hundreds of charts each week and present you with three of our favourite setups and strategies.
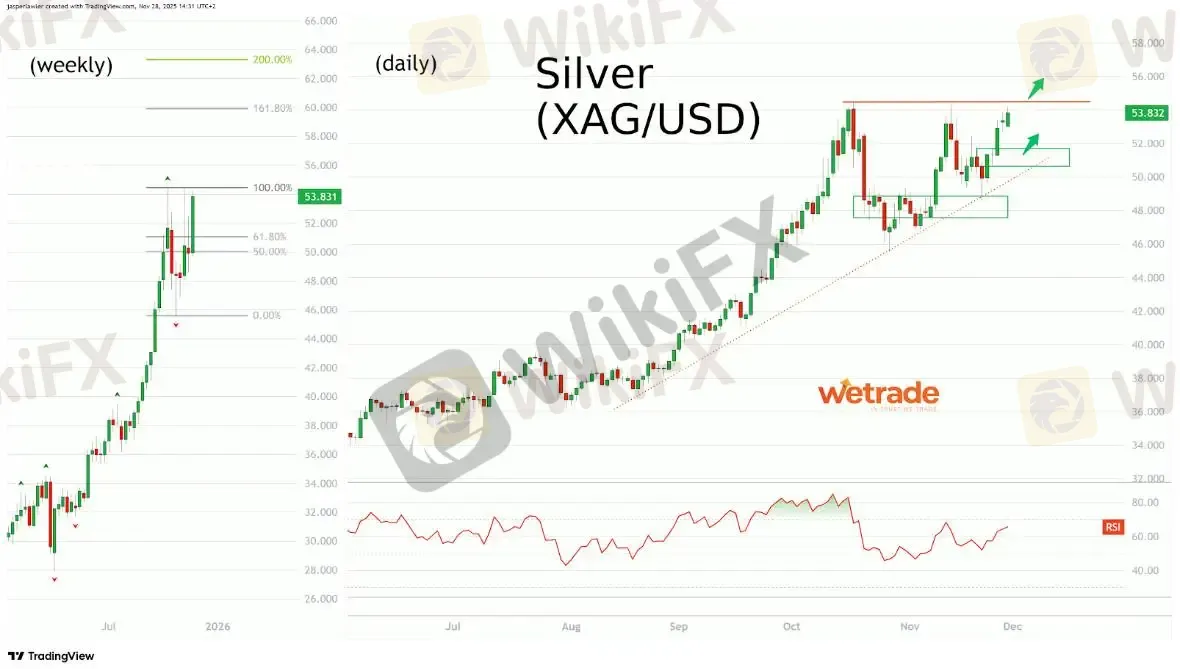
SilverSetup
Bullish trend - breakout
Record highest weekly close
161.8% Fibonacci extension sits at almost exactly $60 per oz
Daily chart testing the top of a triangle pattern
Price has respected rising trendline
Commentary
Silver looks to have completed its pullback from its October peak, setting up a possible breakout to new record highs. Price could pullback again from resistance at $54 or breakout early in the week, meaning a strategy is needed for each scenario.
Strategy
Buy breakout above $54 per oz
Buy pullback to demand area from $51-52 per oz
Setup
Bullish engulfing weekly candle pattern
Follows price hitting 6-month low previous week
Daily RSI is rebounding from oversold conditions - back over 50
Main risk is that price returns to range-bound trading
Commentary
Strategy
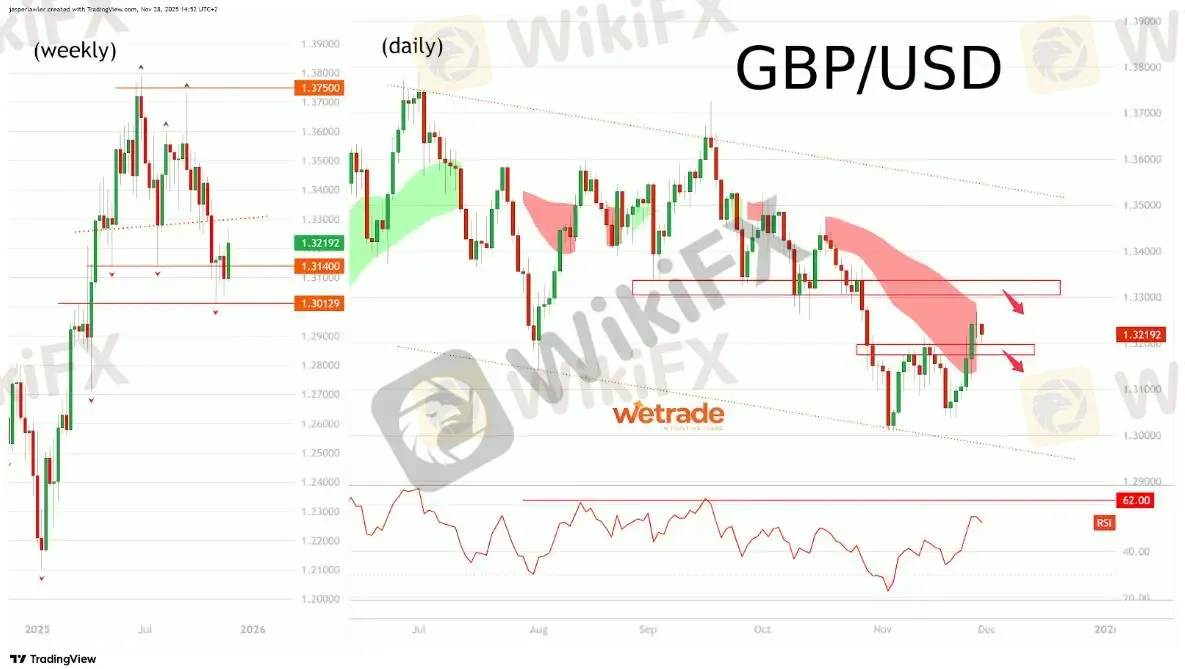
Look for bearish reversals near 1.33
Looks for price to break back below 1.32 to confirm doji star bearish reversal pattern.
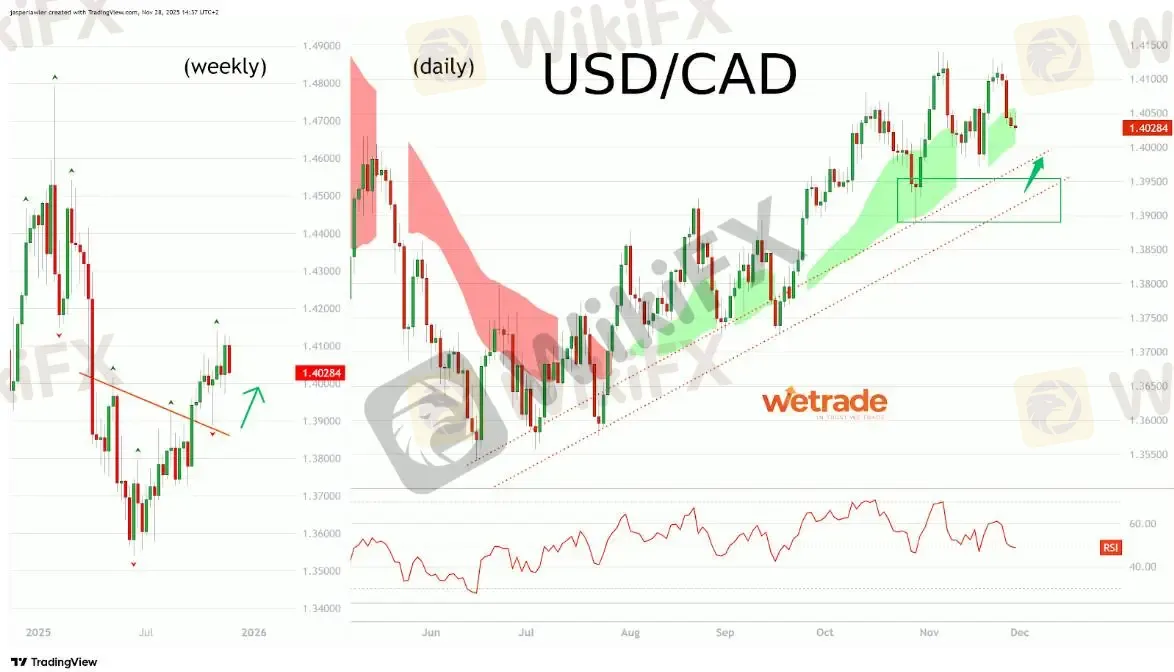
USD/CADSetup
Weekly chart is still overall bullish after inverse H&S pattern
An incomplete double top at 1.41 on daily chart shows larger correction of uptrend
RSI correcting from overbought conditions - still above 50
Commentary
Strategy
Option 2: Sell rebound towards 48,000 supply zone
Option 1: Wait for bearish setup after the break of uptrend line
GBP/USD
Pullback at the start of new bearish trend
A higher low and higher high on the daily chart is not proof of a bullish trend reversal but does show a larger correction (not just a simple pullback) of the downtrend. Former support at 1.33 is now resistance.
Bullish - correction
The Loonie is struggling at 1.41 and could present opportunities to buy at lower levels on the dip near the demand zone around 1.39.
But - as always - thats just how the team and I are seeing things, what do you think?
Disclaimer:
The views in this article only represent the author's personal views, and do not constitute investment advice on this platform. This platform does not guarantee the accuracy, completeness and timeliness of the information in the article, and will not be liable for any loss caused by the use of or reliance on the information in the article.
WikiFX Broker
Latest News
EMAR MARKETS Review 2026: Complaints, High Leverage, and Withdrawal Risk Signals
 WikiFX
EMIRAX MARKETS Review 2026: Unregulated Status, High Leverage, and Withdrawal Complaints
WikiFXHow the Bullet Theory Fixes the Habit of Overtrading
WikiFXReview 2026: Interactive Brokers Regulation, Complaints, and Platform Access
WikiFXReview 2026: STMARKET Regulation, MT5 Access, and Withdrawal Complaint
WikiFXOver 100 Malaysian Retirees Gather to Expose How Investment Scams Wiped Out Their Life Savings
WikiFXSquaredFinancial Review 2026: Heavy Complaints, Withdrawal Delays, and Profit Deletions
WikiFXUbuntu Invest Review 2026: Is This Forex Broker Safe?
WikiFXVonway Forex Review 2026: Withdrawal Complaints, Regulation Warnings, and Account Risks
WikiFXStructuring a Practical Forex Trading Plan and Stop-Loss Strategy
WikiFXCurrency Calculator
USD

CNY
Current Rate:0
Enter amount
USD
Redeemable Amount
CNY
Calculate 