
Global Broker Regulation Inquiry App
WikiFX
English
简体中文
繁體中文
English
Pусский
日本語
ภาษาไทย
Tiếng Việt
Bahasa Indonesia
Español
हिन्दी
Filippiiniläinen
Français
Deutsch
Português
Türkçe
한국어
العربية
U.S. Equities Show Signs of Stabilization While Gold’s Price Action Remains Perplexing
Abstract:Overall geopolitical risk sentiment softened. The primary reason is that former President Trump shifted his messaging toward the Russia–Ukraine conflict, emphasizing efforts to pursue a peace accord a
Overall geopolitical risk sentiment softened. The primary reason is that former President Trump shifted his messaging toward the Russia–Ukraine conflict, emphasizing efforts to pursue a peace accord aimed at narrowing differences and implementing the major agreements reached at the Busan summit.
Following the call, global capital markets staged a relief rally. Investors welcomed both the lack of further geopolitical escalation and dovish commentary from Fed Governor Christopher Waller, who expressed support for another rate cut at the December FOMC meeting. Waller is widely viewed as a potential successor to the Fed Chair position.
Looking ahead, we maintain our view that the U.S. economy remains in a productivity-driven cycle—characterized by strong growth and subdued inflation, a combination that continues to support risk-asset performance.
The November Fund Manager Survey (FMS) further reinforces this sentiment. Global cash allocations have fallen to a historical low, declining from 3.8% to 3.7%, reflecting institutional investors growing optimism toward the macro environment.
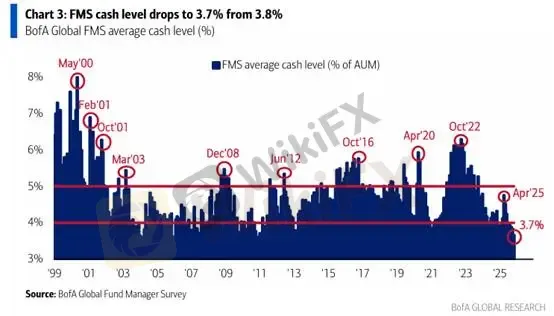
(Chart 1) FMS Fund Manager Cash Allocation
Source: Bank of America (BofA)
(Chart label translation for your image)
Title: Global Fund Manager Cash Levels Hit a New Low
Y-axis: Cash Allocation (%)
Annotation: From 3.8% → 3.7%
Surveyed fund managers also displayed the most optimistic economic outlook since January.
37% expect a no-landing scenario
53% expect a soft landing
Only 6% expect a recession
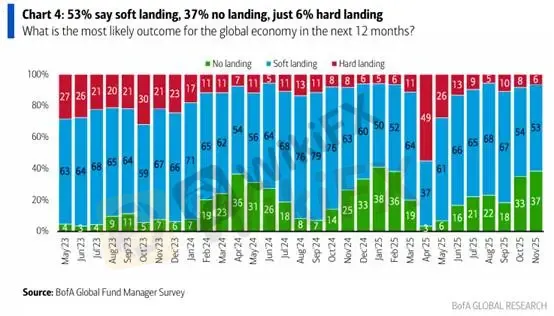
(Chart 2) Fund Manager Outlook at Its Most Optimistic Level Since January
Source: Bank of America (BofA)
(Chart label translation for your image)
Title: Global Economic Expectations Among Fund Managers
Categories: No Landing / Soft Landing / Recession
Turning back to AI development, the “AI arms race” among tech giants has evolved into a battle for energy and land resources. Historically, data centers were measured in megawatts (MW). But with AI infrastructure rapidly scaling, the new threshold has reached the gigawatt (GW) level. As Bloomberg reports (see Chart 3), the power consumption of NVIDIA and Microsofts new Portugal project is equivalent to the entire city of Lisbon.
AI is effectively becoming the next physical industrial revolution. The scale of capital expenditure indicates that Big Tech no longer sees AI as a short-term software boom, but as a long-cycle industrial sector requiring massive and tangible asset investment. Silicon Valley is transforming hundreds of billions of dollars in cash into concrete, semiconductor capacity, and long-term power-purchase agreements.
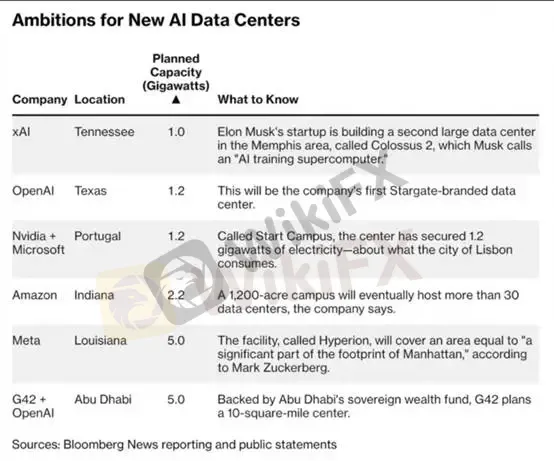
(Chart 3) Big Techs AI Infrastructure Arms Race
Source: Bloomberg
(Chart label translation for your image)
Title: Energy Consumption of AI Data Center Projects
Annotation example: NVIDIA + Microsoft Portugal AI Site = Power Usage Equivalent to Lisbon
Gold Market: A Confusing Divergence
Against this AI-driven productivity boom, golds current price level appears fundamentally inconsistent. Under expectations of strong U.S. growth and softening inflation, gold should typically face downward pressure. However, with the Fed nearing the end of its tightening cycle, the downside for gold appears limited.
This conflicting backdrop increases the likelihood of volatility compression, making both swing trading and short-term entries more challenging. We advise investors to avoid excessive trading during this phase of uncertainty.
Gold Technical Analysis
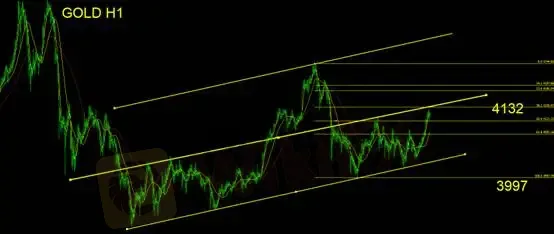
On the hourly chart, gold continues to grind higher, once again testing the $4,132 resistance. Price action remains range-bound.
Key resistance (intraday): $4,132–$4,150
• A confirmed breakout would reopen bullish momentum and allow for channel-based trend-following.
• Failure to break above this zone shifts attention back to the rising trendline support.
Trading Bias: Stay on the sidelines.
Support: 3,997
Resistance: 4,132
Risk Disclaimer
The above analysis, views, research, and price levels are provided solely for general market commentary and do not represent the official position of this platform. All readers should evaluate the risks independently and exercise caution when trading.
Disclaimer:
The views in this article only represent the author's personal views, and do not constitute investment advice on this platform. This platform does not guarantee the accuracy, completeness and timeliness of the information in the article, and will not be liable for any loss caused by the use of or reliance on the information in the article.
WikiFX Broker
Latest News
CFTC Polymarket Approval Signals U.S. Relaunch 2025
 WikiFX
MH Markets Commission Fees and Spreads Analysis: A Data-Driven Breakdown for Traders
WikiFXAlpha FX Allegations: Traders Claim Account Blocks, Withdrawal Denials and Security Breaches
WikiFXHow to Become a Profitable Forex Trader in Pakistan in 2025
WikiFXGratitude Beyond Borders: WikiFX Thank You This Thanksgiving
WikiFXKEY TO MARKETS Review: Are Traders Facing Withdrawal Delays, Deposit Issues & Trade Manipulation?
WikiFXFCA Consumer Warning – FCA Warning List 2025
WikiFXZipphy Exposed: No Valid Regulation, Risk Warning
WikiFXAustralia’s Fraud-Intel Network Exposes $60M in Scams
WikiFXMalaysia’s SkyLine Guide Top 25 Brokers Are Out!
WikiFXCurrency Calculator
USD

CNY
Current Rate: 0
Amount
USD
Available
CNY
Calculate