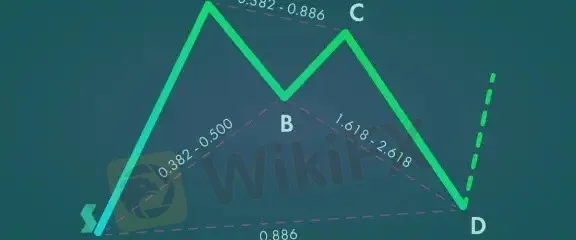
Abstract:Harmonic Patterns are one of the powerful advanced price action techniques that are used to detect reactions.

Harmonic Patterns are one of the powerful advanced price action techniques that are used to detect reactions. The thing that works about Harmonic Patterns is that they use the confluence method, meaning that they expect reactions from clusters of certain levels defined by Fibonacci retracements. The reason they work has nothing to do with mystic or magic whatsoever, it is simply the fact that Fibonacci retracements are used by many traders and their visibility makes reactions more likely, thus increasing the predictive power of the patterns.
What are Harmonic Patterns?
Harmonic trading is a precise and mathematical way to trade, but mastering the patterns takes time, practice, and a lot of research. They are a technical analysis strategy that is based on the relationship between Fibonacci levels and price action in geometric patterns. This technique was first introduced by Harold McKinley Gartley in the early 20th century. The idea is to identify harmonic patterns that appear on a price chart and use them to predict potential market reversals.
They are a set of geometric price patterns that represent specific price relationships between Fibonacci retracement levels.
One of the key features of these patterns is the Potential Reverse Zone (PRZ). This is a price zone where the harmonic pattern is expected to complete and a potential reversal is likely to occur. Traders can use the PRZ to identify the right timing for opening orders and reduce the risk of loss.
These patterns require a good understanding of technical analysis and the ability to recognise different patterns on a price chart. There are several different types of harmonic patterns, including the Gartley, Butterfly, Bat, and Crab patterns. Each pattern has its own unique characteristics and rules for trading. If you‘re feeling lost don’t worry, below well delve into each type so you can get a clear understanding of why people use them.
Exploring the different types and patterns of Harmonic Trading
There is quite an assortment of harmonic patterns, although there are four that seem most popular. These are the Gartley, butterfly, bat, and crab patterns.
The Gartley PatternThis pattern is named after its creator, Gartley. The pattern uses Fibonacci levels to signal the end of a price wave and predict subsequent surges.
The Butterfly PatternThis pattern differs from the Gartley Pattern due to its extended Point D, which indicates a potential price breakout. Traders should confirm a downtrend before entering a trade and set a stop loss to prevent excessive losses.
The Bat PatternShares similarities in structure with the Gartley Pattern, but traders should not confuse the two due to differences in measurements.
The Crab PatternIt is highly accurate and uses the closest Fibonacci numbers to identify potential price reversals. Traders should be aware of the pattern's differences from the Butterfly Pattern to avoid confusion.
Advantages of Harmonic patterns:
• Provide future projections and stops in advance, making them leading indicators
• Frequent, repeatable, reliable and produce high probable setups
• Trading rules are relatively standardized using Fibonacci ratios
• Work well with defined Market Context, Symmetry and Measured Moves rules
• Work in all timeframes and in all market instruments
• Other indicator theories (CCI, RSI, MACD, DeMark…) can be used along with them
Disadvantages of Harmonic patterns:
• Complex and highly technical, making it difficult to understand
• Correct identification and automation (coding) of harmonic patterns is difficult
• Conflicting Fibonacci retracements/projections can create difficulty in identifying reversal or projection zones
• Complexity arises when opposing patterns form from either the same swings or other swings/timeframes
• Risk/reward factors from non-symmetric and low-ranked patterns are pretty low
Moreover, since Harmonic Patterns are based on the principles of price action and Fibonacci levels, they can provide valuable insights into market trends and movements across different instruments and timeframes. By identifying key support and resistance levels and potential price reversals, traders can make more informed trading decisions and increase their overall trading potential.
Can be used in combination with other technical indicators, trading strategies, and trading theoriesThis allows traders to incorporate a variety of analytical tools into their trading approach and make more informed decisions. For example, traders can use moving averages, trend lines, or candlestick patterns in conjunction with Harmonic Patterns to confirm their signals and increase their accuracy.
Furthermore, by combining these patterns with other trading theories such as Elliott Wave Theory or Dow Theory, traders can gain a more comprehensive understanding of the market trends and movements. This can help them identify profitable trading opportunities and make better trading decisions.
Drawbacks of using harmonic patterns in trading
• Trading with Harmonic Pattern has some disadvantages, including the need for beginners to invest more time and effort to study and learn the pattern, which can be challenging.
• Additionally, interpreting the pattern accurately and reading it correctly may require significant effort and experience.
• Another potential disadvantage is that it can sometimes conflict with Fibonacci levels, which are the basis of the pattern. This can lead to confusion and misinterpretation, making it more difficult to make profitable trades using the pattern


