Fibonacci tools, particularly retracement and extension, are some of the most important tools at a professional trader's disposal. This article will discuss: what is Fibonacci? Fibonacci sequence levels, Fibonacci Fan strategy, and how to use fibonacci tools properly with three different methods that will boost the effectiveness of your trading strategy, as well as some other important topics that are useful in relation to Fibonacci tools.
Leonardo Bonacci aka Fibonacci
Leonardo Bonacci aka Fibonacci was born in Pisa around 1170, as the son of a wealthy merchant. He was an Italian mathematician considered to be the most talented western mathematician of the Middle Ages. His book 'Liber Abaci' introduced the Hindu-Arabic numeral system.
What is Fibonacci?
The Fibonacci Sequence (or just simply 'Fibonacci') refers to a set of numbers that begins with either the number 1 or the number 0, succeeded by another number 1, and then the pattern continues based on the rule which states that: all subsequent numbers (or Fibonacci numbers) will be equal to the amount of the two numbers that preceded them (or the sum of the two previous numbers).
Nowadays, Fibonacci levels are used in all types of trading including stocks, futures, commodities, cryptocurrencies, and also Forex trading. The Fibonacci levels, with its retracements and targets, are one of the best tools in the entire field of technical analysis. Its strong support & resistance levels are exact and explicit. Most importantly, Fibonacci offers very defined and precise entry and exit spots. The Fibonacci levels (or just Fibs) are derived from the Fibonacci sequence numbers.
Fibonacci Sequence Levels
The Fibonacci sequence numbers are as follows: 0, 1, 1, 2, 3, 5, 8, 13, 21, 34, 55, 89, 144, 233, 377, 610, 987, 1597, etc. This series of numbers is created by always adding the last two numbers together:
0 + 1 = 1
1 + 1 = 2
1 + 2 = 3
2 + 3 = 5
3 + 5 = 8 etc.
If we apply it to higher numbers, we will still have the same perfect sequence.
89 + 144 = 233,
144 + 233 = 377, etc
You might be wondering why these Fibonacci sequence numbers are so significant. There are multiple reasons, including:
That the Fibonacci sequence numbers are strongly respected on the charts, as a vast majority of traders use them.
That the Fibonacci sequence levels are used for calculating Fibonacci retracements and Fibonacci targets, which are levels frequently used in the market.
These numbers are not only used in trading markets, but can, in fact, be observed all around us: In crystal formations, or by being played out in musical progressions. In the growth of rabbit populations, and even in the DNA spiral. The whole human body itself is full of Fibonacci relationships
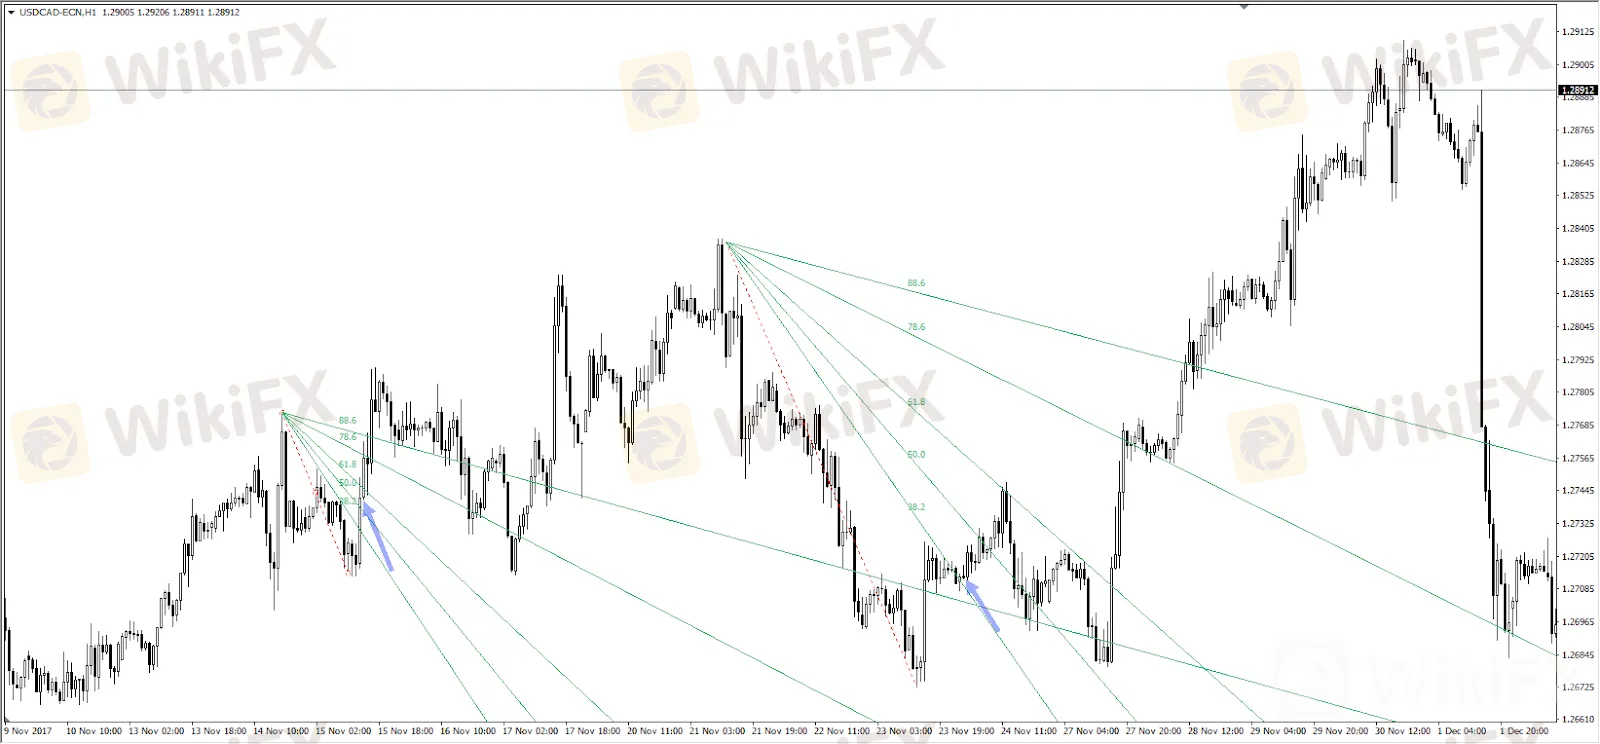
Fibonacci Tools: the Fibonacci Fan Strategy
The Fibonacci Fan is comprised of three lines set at the central Fibonacci retracement numbers. Those are:
Very often, the main supporting level on the Fibonacci Fan is the 61.8%. By applying the following rule, we might have a good chance for an entry purely based on Fibonacci Fan trading. Fibonacci Fan is the default indicator on MetaTrader 4 (MT4) and MetaTrader 5 (MT5), and you can assess it directly. Once the price breaks the 38.2% level, it will usually go to the 61.8% level. We can make an entry at 38.2, aiming for 61.8. This rule works best in a trending environment, but it can also be used in a countertrend.
Admiral Markets MT4
Fibonacci Tools: Fibonacci Expansion Custom Levels
Fibonacci Expansion is a default tool available in MetaTrader, which is also crucial for price actiontargets. We will now introduce the essential Fibonacci Expansion levels that you might want to use with different trading strategies. In order to add custom levels to the Fibonacci Expansion tool, you first need to select the tool from the drop-down menu in MetaTrader 4. This is how you do it:

GBP/USD H1 chart
Once you have selected the tool in 'Properties', add the following levels:
FE 61.8
FE 100.0
FE 138.2
FE 150
FE 161.8
FE 200
Enter some of these levels manually within the indicator properties.
The characteristics of these levels are important for the price analysis and will add up to 1-2-3 pattern trading.
This is the first important level of the tool. It doesn't usually act as a strong support or resistance when the price approaches it directly, but rather, when the 61.8 support or resistance has already been broken (backward approach). It then transforms into a strong S/R level.
This is considered to be a weak Support & Resistance level. If, for example, the 1-2-3 pattern point 3 equals or is close to 61.8 of 1-2 retracement, the FE 100 should be a strong S/R level.
This is a level similar to the 61.8 FE, with very similar characteristics.
A very strong S/R level, usually strong for USD crosses, where the USD is the base currency (e.g. USD/CHF, USD/JPY, USD/CAD, USD/SGD etc.). It is also a strong level for EUR based crosses, where the EUR is the base currency (e.g. EUR/USD, EUR/GBP, EUR/JPY etc.).
A very strong S/R level that possibly marks the end of a correction.
Possibly the strongest S/R level that marks the end of a correction, a price reversal, and the change of the trend.
Fibonacci Tools: Fibonacci 50.0 with the EMA Channel Strategy
This strategy is easy to apply. It uses the following indicators:
EMA (Exponential Moving Average) 15 set on Close (black)
EMA 50 set on High (blue)
EMA 50 set on Low (red)
Admiral Pivot set on Daily
Time Frame: H1
Long Entry Position
Check if the slope of the channel is sloping up
The price needs to be above the channel
Wait for a retracement
Draw a Fibonacci Retracement of the last swing from the bottom to the top
The price needs to touch or come close to 23.6, 38.2, and the 50.0 Fibonacci level
Place a long entry by scaling in (divide your total lot size in three separate entries)
Short Entry Position
Check if the slope of the channel is sloping down
The price needs to be above the channel
Wait for a retracement
Draw a Fibonacci Retracement of the last swing from the top to the bottom
The price needs to touch or come close to 23.6, 38.2 and the 50.0 Fibonacci level
Place a short entry by scaling in (divide your total lot size on three separate entries)
Targets are placed at Admiral Pivots, while the stop-loss is placed below the last swing low (for long trades) and above the previous swing high (for short trades).
For example, if you decided to enter with 0.3 lots. In order to scale in properly, you need to divide 0.30 lots by 3. So, you will add 0.10 when the price touches the 23.6, and another 0.10 will be added at 38.2, and the final part of 0.10 will be added at 50.0 Fib, if the price makes a retracement to all 3 Fibs. If the price doesn't make a retracement to 38.2 and 50.0, you will probably have only ⅓ of the trade running (23.6). Profits can grow significantly and losses may be lower if you use the scaling-in technique.

GBP/JPY H1 chart
How to Use Fibonacci Trading Tools with Risk-Free Demo Trading
Trader's also have the ability to trade risk-free with a demo trading account. This means that traders can avoid putting their capital at risk, and they can choose when they wish to move to the live markets.
----------------
WikiFX, the world's No.1 broker inquiry platform!
Use WikiFX to get free trading strategies, scam alerts, and experts experience!
Android : cutt.ly/Bkn0jKJ
iOS : cutt.ly/ekn0yOC


