

Broker Globale Piattaforma di Verifica Regolamentare
WikiFX
Italiano
简体中文
繁體中文
English
Pусский
日本語
ภาษาไทย
Tiếng Việt
Bahasa Indonesia
Español
हिन्दी
Filippiiniläinen
Français
Deutsch
Português
Türkçe
한국어
العربية
اردو
DBG Markets: Market Report for June 24, 2026
Sommario:Tech Sell-Off Amid Aggressive Fed Repricing Energy Risk Premium Eased US Indices, EURUSD, Gold Crude Oil OutlookGlobal equity markets experienced a massive sell-off on Tuesday, with the tech-heavy N

Tech Sell-Off Amid Aggressive Fed Repricing & Energy Risk Premium Eased
US Indices, EURUSD, Gold & Crude Oil Outlook
Global equity markets experienced a massive sell-off on Tuesday, with the tech-heavy Nasdaq leading the decline by plunging 2.2%. This downside momentum continues to be fueled by surging expectations of an impending Federal Reserve rate hike sequence.
Fed Hike Bets & Geopolitical Optimism Drives Markets
According to the CME FedWatch Tool, the interest rate futures market has aggressively priced in a tightening move for the upcoming September 2026 meeting. The tool currently shows a 50.6% probability of a 25-basis-point rate hike and a 19.6% probability of a more aggressive 50-basis-point rate hike.
This structural hawkish shift continues to apply immense valuation pressure on equities, with the high-multiple technology sector bearing the brunt of the liquidations.
Technical Outlook & Asset AnalysisUS Equities Outlook
Major US indices face severe short-term technical pressure. Driven by overextended valuations across the Artificial Intelligence (AI) sector and an aggressive reset in global interest rate expectations, tech-heavy indices are poised to remain on the front lines of the current market correction.
Nasdaq 100 Analysis
As covered on our analysis yesterday, the reset in Fed rate expectations posed a strong headwind for the tech sector, leading to a near-term pullback risk in the Nasdaq 100 Index.
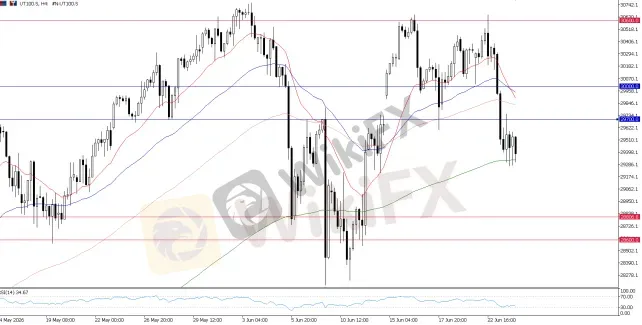
UT100, H4 Chart
S&P 500 Analysis
Similarly, on the S&P 500 (US500), due to its heavy concentration in mega-cap technology shares, the broader index is also directly exposed to the sector-led rotation.
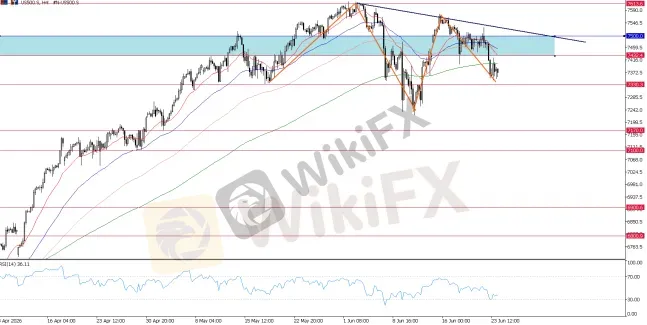
US500, H4 Chart
For the US500, the break below 7,500 after failing to form a higher high suggests the bullish momentum for the benchmark index is fading out. Watch key downside levels, where resistance lies at 7,430 – 7,500; below here we may see continued pressure.
US Dollar Index & EURUSD Outlook
The US Dollar Index maintains a strong, constructive bullish bias across multiple timeframes. The combination of an increasingly restrictive monetary policy path and steady safe-haven flows continues to form a highly resilient floor for the greenback.
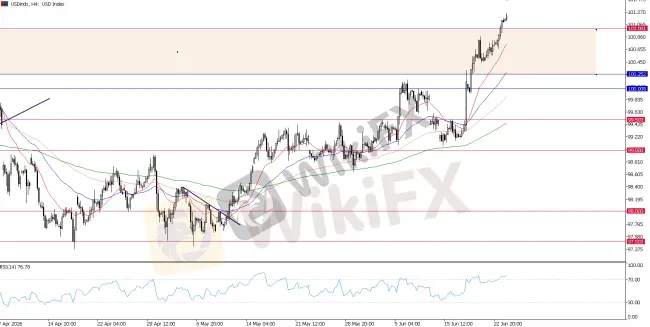
USD Index, H4 Chart
For the dollar, the bullish momentum and bias should remain unless we see a sharp turn that pushes the dollar back below the zone as marked in the chart.
EURUSD Analysis
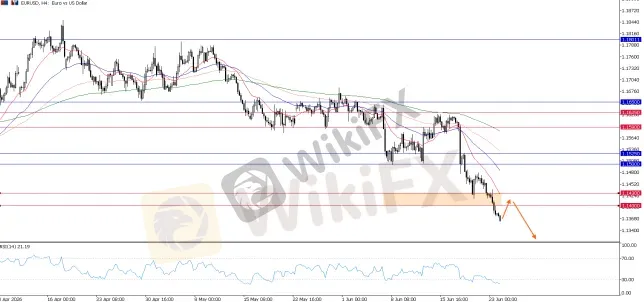
EURUSD, H4 Chart
Mirroring the dollar's breakout, EUR/USD has broken major support baselines of 1.1400 – 1.14300—where this has been crucial in the past one year. Rallies should be treated as temporary counter-trend retracements, with the path of least resistance pointing firmly downward.
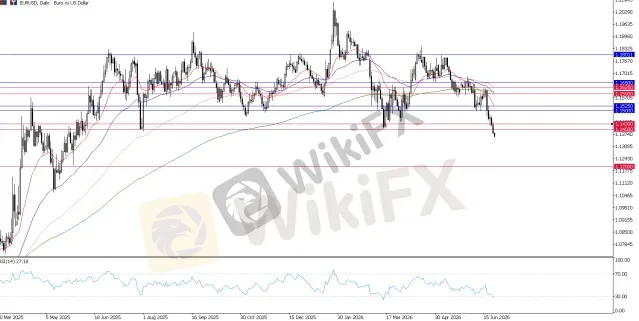
EURUSD, Daily Chart
With the break of the 1.1400 major baseline, the pair could now have the path of least resistance down to the 1.1200 area.
Gold (XAU/USD) Outlook
Surging interest rate expectations and climbing US Treasury yields continue to heavily penalize non-yielding assets, leaving gold vulnerable to ongoing liquidation. Our outlook for gold remains unchanged from earlier this weeks analysis.
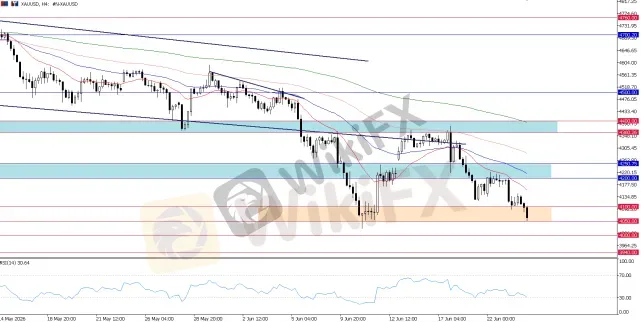
XAUUSD, H4 Chart
But until then, gold remains heavily bearish, where any intraday bounce should be seen as a short.
Crude Oil Outlook
For both crude benchmarks, the geopolitical risk premium is completely squeezed out, opening the door for more downside moves.
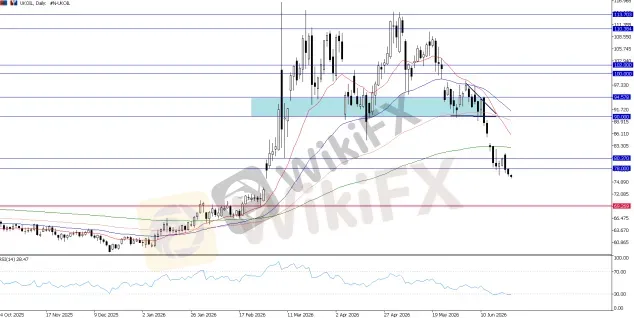
UKOIL, Daily Chart
Brent crude is currently testing a crucial psychological and structural floor near the $77 – $80 per barrel level, which forms a vital support zone for Brent.
Bottom Line & Summary
The macro narrative is firmly driven by aggressive Fed tightening expectations and an unwinding commodity risk premium as diplomatic progress accelerates in the Middle East.
With the tech sector enduring a comprehensive valuation reset ahead of tomorrow's critical US PCE inflation report and crude oil sliding as safe-haven premiums vanish, market participants should maintain a defensive posture. The US Dollar remains the absolute beneficiary of this macro landscape, keeping both equity indices and precious metals heavily capped.
Asset Summary:
· US Tech 100 (UT100): Bearish under 30,000; the breakdown confirms supply dominance, exposing a deeper testing level near 28,800.
· S&P 500 (US500): Bearish bias below 7,430 – 7,500; momentum has faded with key structural support down at 7,330.
· US Dollar Index: Bullish; cleared the critical 101.00 level, opening the technical path for continued upside expansion.
· EURUSD: Bearish; a clear violation of the 1.1400 baseline opens the least resistance path down toward 1.1200.
· Gold (XAU/USD): Heavily bearish near-term; intraday bounces remain shorting opportunities, tracking $4,050 – $4,100 for institutional buying.
· Crude Oil (UKOIL/USOIL): Bearish structure; geopolitical premiums are gone, keeping the broader bias as “sell-the-rally” even as Brent tests the $77 – $80 zone.

Disclaimer:
Le opinioni di questo articolo rappresentano solo le opinioni personali dell’autore e non costituiscono consulenza in materia di investimenti per questa piattaforma. La piattaforma non garantisce l’accuratezza, la completezza e la tempestività delle informazioni relative all’articolo, né è responsabile delle perdite causate dall’uso o dall’affidamento delle informazioni relative all’articolo.
WikiFX Trader
Rate Calc
USD

CNY
Tasso di cambio attuale:0
inserisci l'importo
USD
A disposizione
CNY
Calcolare 