
Broker Globale Piattaforma di Verifica Regolamentare
WikiFX
English
简体中文
繁體中文
English
Pусский
日本語
ภาษาไทย
Tiếng Việt
Bahasa Indonesia
Español
हिन्दी
Filippiiniläinen
Français
Deutsch
Português
Türkçe
한국어
العربية
DBG Markets: Market Report for Apr 2, 2026
Sommario:Risk Assets Face Intense Challenge at Major Levels Amid Risk-OffEquities, Crypto Gold OutlookUS Equities Outlook: A High-Stakes Tug-of-WarThe US stock market is currently locked in a fierce battle be

Risk Assets Face Intense Challenge at Major Levels Amid Risk-OffEquities, Crypto & Gold Outlook
US Equities Outlook: A High-Stakes Tug-of-War
The US stock market is currently locked in a fierce battle between optimistic dip-buyers and structurally dominant bears. Both the S&P 500 and the Nasdaq 100 are hovering at major pivot levels, creating a high-stakes tug-of-war.
However, the overarching macroeconomic outlook remains decidedly bearish for now. The ongoing US-Iran conflict continues to inject a massive geopolitical risk premium into the markets, while the resulting energy shocks keep sticky inflation fears alive.
Nasdaq100 Outlook
For the tech-heavy Nasdaq 100, the prolonged risk-off sentiment and high Treasury yields are heavily weighing on major growth drivers like Nvidia and other tech giants.
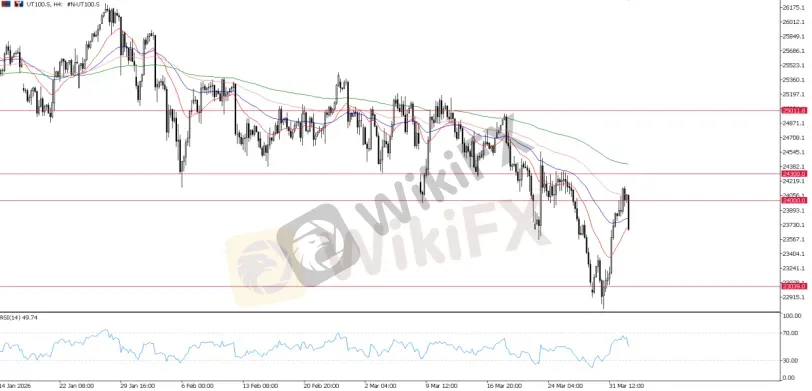
UT100, H4 Chart
The index is desperately fighting to maintain its footing near the 23,000 to 24,000 zone.
As covered in our earlier analysis, the 24,000 mark remains a major resistance zone. This is the definitive pivot level determining bull or bear territory. We are currently seeing significant selling pressure near 24,000, which elevates downside risks and suggests a likely retest of the 23,000 level, or potentially even lower.
Any intraday bounces appear to be fragile short-covering rallies rather than genuine structural reversals.
S&P500 Outlook
Similarly, the S&P 500 is struggling near the 6,500 mark. Until there is a definitive diplomatic resolution in the Middle East or a significant cooling of inflation data, the path of least resistance for US equities remains skewed to the downside, making them prime "sell the rally" candidates.
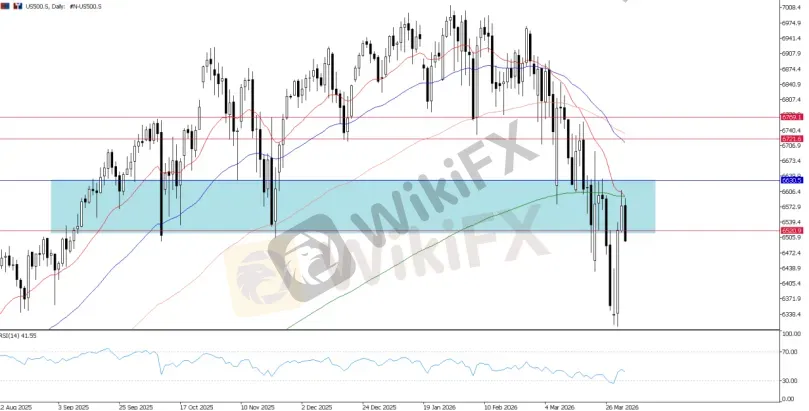
US500, Daily Chart
Technically, we see sustained pressure near the current 6,520–6,630 zone. This signals that this area remains a crucial resistance block that bulls must retake to establish any intraday or near-term momentum. If prices remain pressured below this level, the downside bias remains firmly intact.
Cryptocurrency Outlook: BTC and ETH Caught in the Crossfire
The cryptocurrency market is entirely caught in the crossfire of the broader macroeconomic panic. Bitcoin (BTC) and Ethereum (ETH) are struggling to find a clear directional narrative, torn between their speculative risk-asset nature and the narrative of decentralized safe havens.
Currently, the crushing weight of high US Treasury yields and a dominant US Dollar are overpowering any safe-haven bids for digital assets.
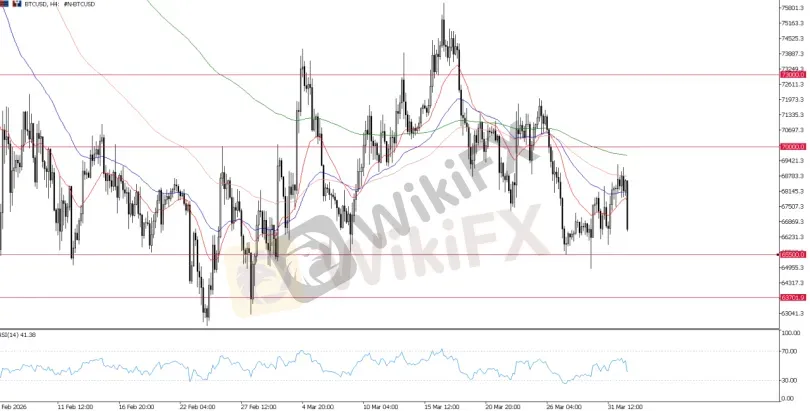
BTCUSD, H4 Chart
Bitcoin is facing heavy overhead resistance and remains highly sensitive to broader risk-off flows across the financial markets. Technically, the failure to regain the 70,000 level could trigger another wave of downside pressure.
For now, traders should closely monitor the 65,500–70,000 zone.
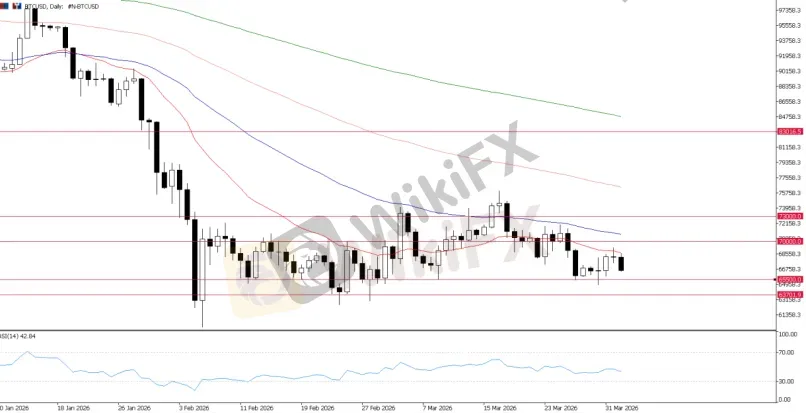
BTCUSD, Daily Chart
A clear break below the 63,700–65,500 support zone would likely catalyze a broader sell-off in Bitcoin. Conversely, if BTC can reclaim the 70,000 level, upside momentum is likely, suggesting that cryptocurrencies may start to outpace the traditional equities market.
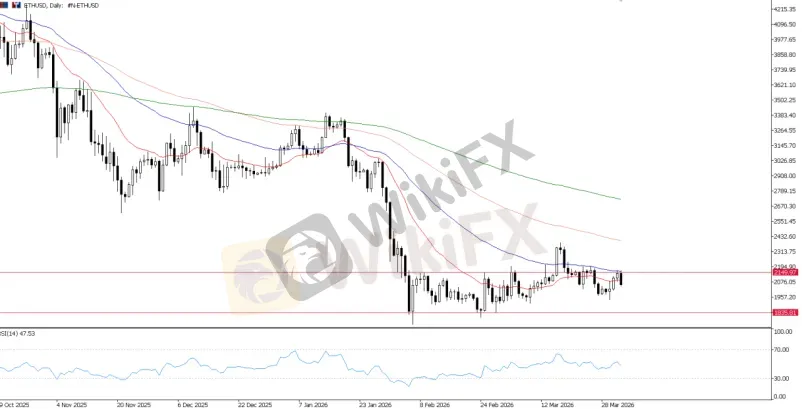
ETHUSD, Daily Chart
Ethereum mirrors this vulnerability, struggling to attract sustained buying volume in an environment where capital is fleeing toward traditional, yield-bearing safe havens. Both major cryptocurrencies remain firmly in a defensive consolidation phase.
For ETH/USD, the 1,835–2,150 zone is the key range to watch, with 2,000 serving as the critical psychological pivot. A decisive break out of this range is needed to dictate the upcoming trend.
Gold Outlook: Safe-Haven Bids vs. High Yields
Gold continues to act as the ultimate barometer for global anxiety. The precious metal is locked in a volatile range, caught between the heavy gravitational pull of skyrocketing US Treasury yields and the desperate demand for geopolitical safe havens.
The ongoing conflict in the Middle East is preventing a structural collapse in Gold prices, ensuring that dip-buyers remain active at lower valuations.
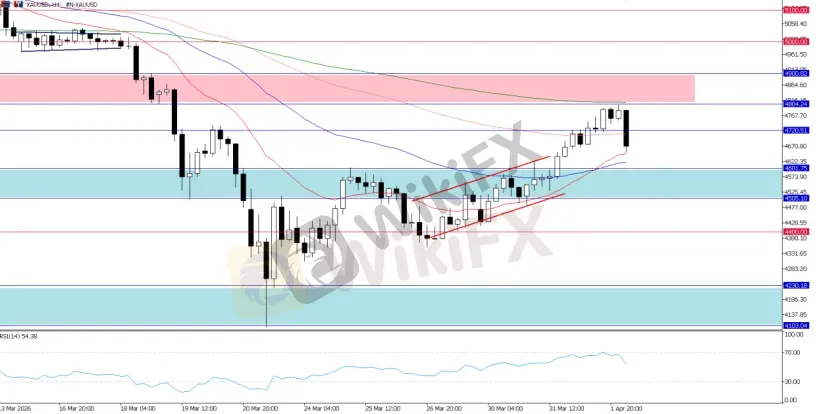
XAUUSD, H4 Chart
Currently, Gold is fiercely defending the $4,500 to $4,600 psychological zone. As long as the geopolitical landscape remains fractured, the precious metal will maintain a solid underlying bid.
As noted yesterday, $4,800 remains the key overhead resistance for now, while $4,600 acts as structural support. In the near term, gold is likely to remain range-bound and trade within this $4,600–$4,800 corridor.
Bottom Line & What to Watch Today
The global financial markets remain a treacherous landscape dominated by war headlines and inflation fears. Expect erratic intraday volatility as bulls and bears fight for control at major technical levels.

Disclaimer:
Le opinioni di questo articolo rappresentano solo le opinioni personali dell’autore e non costituiscono consulenza in materia di investimenti per questa piattaforma. La piattaforma non garantisce l’accuratezza, la completezza e la tempestività delle informazioni relative all’articolo, né è responsabile delle perdite causate dall’uso o dall’affidamento delle informazioni relative all’articolo.
WikiFX Trader
WikiFX Trader
Rate Calc
USD

CNY
Tasso di cambio attuale:0
inserisci l'importo
USD
A disposizione
CNY
Calcolare 