
Applicazione di richiesta di informazioni sulla regolamentazione dei broker globali
WikiFX
English
简体中文
繁體中文
English
Pусский
日本語
ภาษาไทย
Tiếng Việt
Bahasa Indonesia
Español
हिन्दी
Filippiiniläinen
Français
Deutsch
Português
Türkçe
한국어
العربية

DBG Markets: Market Report for Mar 4, 2026
Sommario:Global Equities Slide on Middle East Tension: Brace for More Impact?Oil, US Indices, Gold CAD OutlookGlobal markets are bracing for prolonged uncertainty as the conflict between the US, Israel, and I

Global Equities Slide on Middle East Tension: Brace for More Impact?Oil, US Indices, Gold & CAD Outlook
Global markets are bracing for prolonged uncertainty as the conflict between the US, Israel, and Iran escalates. The immediate threat of transit disruptions through the vital Strait of Hormuz has reintroduced a massive geopolitical risk premium into the energy markets.
While the energy sector thrives on the chaos, global equities are feeling the heat, with US stock markets facing the risk of a deeper correction as investors rapidly rotate capital out of risk assets and into safe havens.
Oil Surges as Fears of Supply Disruptions
With Iran warning that it will attack any ships attempting to pass through the Strait of Hormuz, oil prices surged again yesterday, fueled by fears that supply disruptions will further intensify.
Following reports of potential shipping bans and vessel movements pausing, logistical bottlenecks have created immediate short-term supply risks that could evolve into a prolonged crisis if there is no significant de-escalation in the region.
Brent Outlook
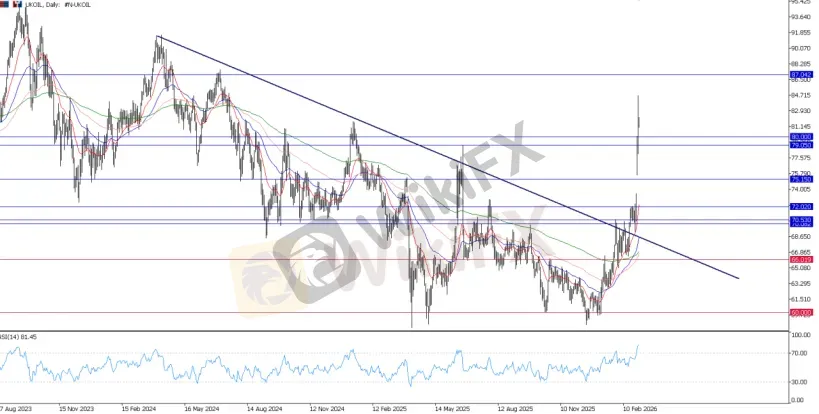
UKOIL, Daily Chart
Undoubtedly, oil continues to dominate market headlines. Prices surged again during Tuesday's session, driving Brent crude (UKOIL) past the 80.00 mark to hit an 8-month high.
With the breakout above this key technical and psychological level, the 80.00 mark now serves as an immediate support floor. As long as transit through the Strait of Hormuz remains compromised, oil prices will likely stay firmly elevated.
The next target could now sit between the 87.00 and 90.00 zone, reflecting highs last seen in mid-2025, which currently stands as the major liquidity zone.
Equities Face Correction Risk Amid Energy Surge
In the equities market, global indices are facing a brutally massive sell-off, particularly across European and Asian markets. Meanwhile, the US market also experienced heavy selling, and despite a late-night rebound, the risk of a much deeper correction remains highly elevated.
The combination of surging oil prices, which reignite inflation fears, and a stronger US Dollar is creating a highly toxic environment for equities. This means that despite recent resilience, the US market may not be spared from this heavy wave of risk aversion.
Dow Jones Reversal Confirm?
The “higher for longer” interest rate narrative is now back in full force alongside broader risk aversion, and US indices are exhibiting significant structural weakness.
The Dow Jones Industrial Average (US30) has confirmed a break of its prior bullish structure due to recent heavy selling pressure, opening the door to a phase of greater short-term indecision.
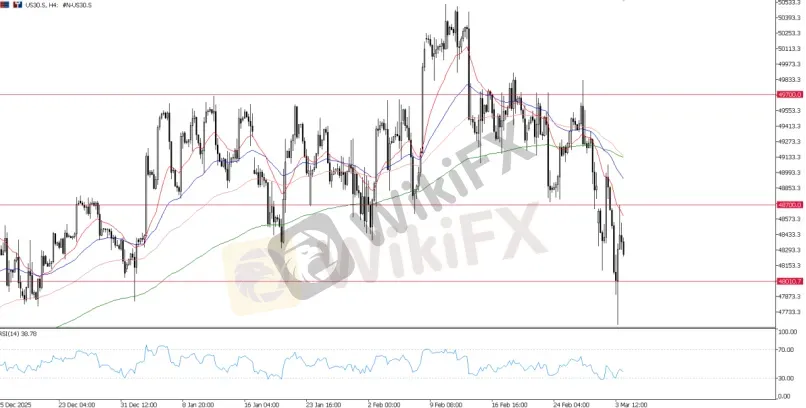
US30, H4 Chart
As we covered earlier, the head and shoulders pattern on the US30 has played out. The neckline near 48,700 was broken, subsequently retested, and firmly rejected.
The 48,700 level now acts as the major resistance pivot. A failure to regain ground above this level confirms that bearish momentum dominates, potentially triggering a deeper technical correction across the broader US market. The 48,000 marks now stands as the next critical pivot level.
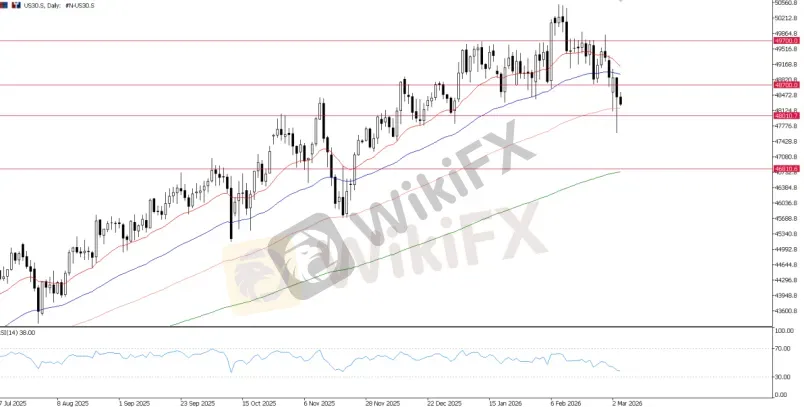
US30, Daily Chart
Should we see a decisive break below 48,000, a deeper correction within the broader macro trend may push the Dow Jones down into the 47,000 to 46,800 zone, sending the index closer to its 200-day moving average.
Gold: Dip on Strong Dollar, But Broadly
Supported In the precious metals market, Gold experienced a significant dip yesterday as traders weighed a surging US Dollar and rising Treasury yields against the ongoing geopolitical panic.
The strength of the Greenback and shifting expectations away from near-term Fed rate cuts have introduced natural headwinds for the yellow metal.
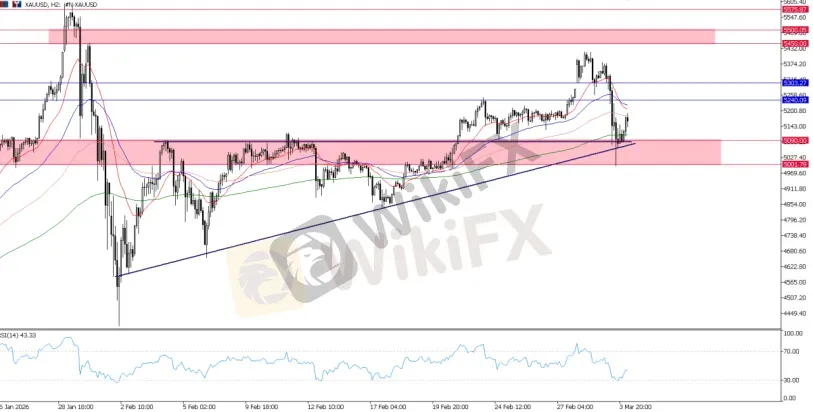
XAUUSD, H2 Chart
However, from a technical perspective, Gold remains incredibly well-supported, with safe-haven demand highly likely to kick in on any substantial dips. Technically, the 5,000 to 5,100 region now acts as a formidable, ironclad support base.
As long as Gold maintains its footing above the 5,000 psychological level, the overarching bullish structure remains entirely intact.
Canadian Dollar: Benefiting from Commodities Gain
While the US Dollar dominates across the board, the Loonie is showing notable resilience. If oil prices remain elevated above the 80.00 mark, the CAD is well-positioned to maintain its strength against weaker major currencies, acting as a proxy trade for the surging energy sector.
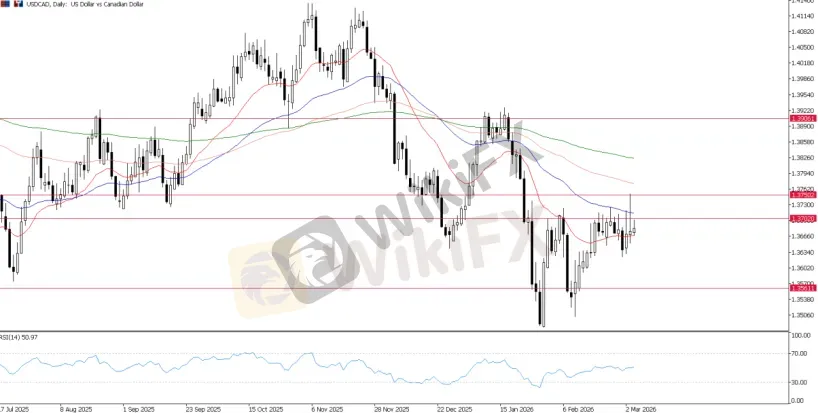
USDCAD, Daily Chart
Technically, USDCAD failed to capitalize on broader Dollar strength to surge against the CAD, and is now capped below the 1.3700 major resistance level. With both currencies currently exhibiting dominant traits, USDCAD is likely to remain range-bound within the 1.3560 to 1.3700 area.
Bottom Line & Whats Next?
The financial markets are currently locked in a highly reactive state, completely overshadowed by the threat of a prolonged Middle East war.

Disclaimer:
Le opinioni di questo articolo rappresentano solo le opinioni personali dell’autore e non costituiscono consulenza in materia di investimenti per questa piattaforma. La piattaforma non garantisce l’accuratezza, la completezza e la tempestività delle informazioni relative all’articolo, né è responsabile delle perdite causate dall’uso o dall’affidamento delle informazioni relative all’articolo.
WikiFX Trader
IC Markets Global
Sotto supervisione
Exness
Sotto supervisione
XM
Sotto supervisione
GTCFX
Sotto supervisione
D prime
Supervisione del paese
TMGM
Sotto supervisione
IC Markets Global
Sotto supervisione
Exness
Sotto supervisione
XM
Sotto supervisione
GTCFX
Sotto supervisione
D prime
Supervisione del paese
TMGM
Sotto supervisione
Rate Calc
USD

CNY
Tasso di cambio attuale:0
inserisci l'importo
USD
A disposizione
CNY
Calcolare 