
Broker Globale Piattaforma di Verifica Regolamentare
WikiFX
English
简体中文
繁體中文
English
Pусский
日本語
ภาษาไทย
Tiếng Việt
Bahasa Indonesia
Español
हिन्दी
Filippiiniläinen
Français
Deutsch
Português
Türkçe
한국어
العربية
A Stronger Yen, a Weaker U.S. Dollar
Sommario:The latest catalyst behind gold‘s renewed upside came from the Japanese yen. On the 8th, Japan’s Finance Minister Satsuki Katayama stated that Japan would remain in close communication with U.S. Treas
The latest catalyst behind gold‘s renewed upside came from the Japanese yen. On the 8th, Japan’s Finance Minister Satsuki Katayama stated that Japan would remain in close communication with U.S. Treasury Secretary Bessent, with the shared objective of stabilizing both the U.S. dollar and the yen. She emphasized that authorities would take action against any rapid currency fluctuations that deviate from economic fundamentals, a clear reference to potential currency market intervention.
The yen initially strengthened before reversing lower. After briefly testing 157.65, it failed to hold gains and turned downward. During today‘s Asian session, USD/JPY was trading near 155.85, with downside momentum yet to fully stabilize. The yen’s appreciation weighed heavily on the U.S. Dollar Index, which fell nearly 1%, helping push gold prices back above the USD 5,000 per ounce threshold.
Fiat Currency Depreciation Remains the Core Bullish Narrative for Gold
Market consensus supporting gold‘s longer-term upside continues to center on fiat currency depreciation. As purchasing power erodes, gold’s role as a store of value strengthens, forming the structural foundation of its long-term bullish trend.
Recently, U.S. Treasury Secretary Bessent noted that even if Kevin Warsh were to succeed as Chair of the Federal Reserve, the central bank would not move quickly to reduce its USD 6 trillion-plus balance sheet. He estimated that it could take up to a year for the Fed to determine the future direction of its balance sheet and emphasized that Warsh would operate with a high degree of independence.
The implicit message to markets is clear: despite Warshs historical criticism of quantitative easing (QE) and his preference for balance sheet reduction, any tightening would not occur immediately. This suggests a policy transition period rather than an abrupt liquidity drain, even in the event of leadership change.
")
Figure 1: Fiat Currency Depreciation and the Long-Term Decline in Golds Purchasing PowerSource: MacroMicro (M平方)Long-Term Trends Do Not Explain Short-Term Volatility
For investors, it is critical to distinguish between long-term structural trends and short-term market behavior. Attempting to justify short-term price swings using long-term narratives often leads to a common pitfall: being right on the trend, but losing money on volatility.
From a real purchasing power perspective, we argue that AI-driven productivity gains could ultimately support a stronger U.S. dollar over the long run. As long as real U.S. GDP growth outpaces fiat currency depreciation, real interest rates may re-anchor relative to gold. At the root of this shift would be an effective reduction in U.S. debt burdens, at which point market sentiment could pivot sharply toward owning dollars and reducing gold exposure.
This dynamic mirrors historical precedent. In 2011, when then-Fed Chair Ben Bernanke initiated QE tapering, gold prices entered a prolonged decline.
Gold Technical Analysis
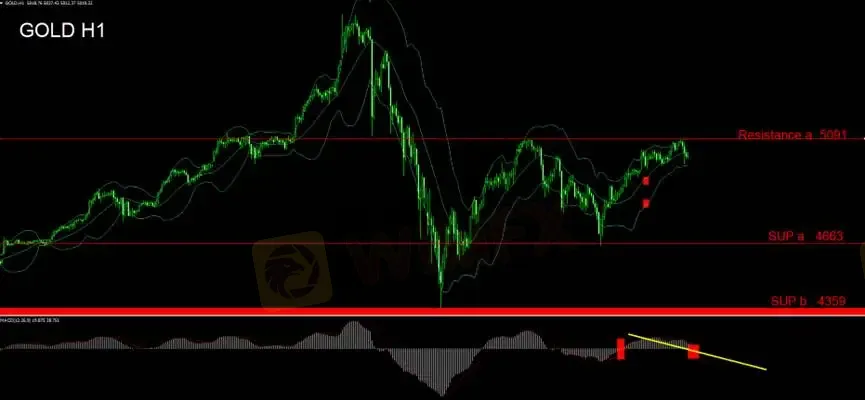
Gold remains in a short-term upward attack mode, with Bollinger Bands expanding to the upside. However, traders should closely monitor whether bullish momentum can sustain.
During the Asian session, prices encountered resistance at the prior high near 5,091, triggering a pullback and the formation of a bearish candle. This level presents an opportunity for short-term tactical short positions. A decisive break above 5,091 would signal renewed upside momentum, at which point stops should be triggered and positions reversed to long.
The MACD oscillator remains above the zero line, but histogram bars are showing signs of contraction, warranting caution against a potential downside crossover.
If short positions prove successful and daily candlesticks form a parallel bullish–bearish structure, traders may consider holding positions for overnight swing trades.
Trading Strategy
The daily candlestick has not yet confirmed a bearish mother-and-child pattern. As such, overnight short positioning should remain on hold.
The Asian session has reached a key resistance zone. 5,091 serves as the critical bull–bear pivot. Short-term shorts may be tested near this level, while a breakout above 5,091 calls for a swift reversal to long positions.
Key Levels
Resistance A: 5,091
Support A: 4,663
Support B: 4,359
Risk Disclosure
Resistance
Support
The above views, analyses, research, prices, and other information are provided solely for general market commentary and do not represent the position of this platform. All readers bear full responsibility for their own investment decisions. Please trade with caution.
Disclaimer:
Le opinioni di questo articolo rappresentano solo le opinioni personali dell’autore e non costituiscono consulenza in materia di investimenti per questa piattaforma. La piattaforma non garantisce l’accuratezza, la completezza e la tempestività delle informazioni relative all’articolo, né è responsabile delle perdite causate dall’uso o dall’affidamento delle informazioni relative all’articolo.
WikiFX Trader
XM
Sotto supervisione
FXCM
Sotto supervisione
vantage
Sotto supervisione
EBC FINANCIAL GROUP
Sotto supervisione
VT Markets
Sotto supervisione
D prime
Supervisione del paese
XM
Sotto supervisione
FXCM
Sotto supervisione
vantage
Sotto supervisione
EBC FINANCIAL GROUP
Sotto supervisione
VT Markets
Sotto supervisione
D prime
Supervisione del paese
Rate Calc
USD

CNY
Tasso di cambio attuale:0
inserisci l'importo
USD
A disposizione
CNY
Calcolare 