
Broker Globale Piattaforma di Verifica Regolamentare
WikiFX
English
简体中文
繁體中文
English
Pусский
日本語
ภาษาไทย
Tiếng Việt
Bahasa Indonesia
Español
हिन्दी
Filippiiniläinen
Français
Deutsch
Português
Türkçe
한국어
العربية
Sovereign Bond Sell-Off Chain Reaction
Sommario:Has the Japanese Yen Reached Its Bottom?U.S. and Japanese government bonds have recently come under heavy selling pressure. Paradoxically, rising risk aversion has instead fueled golds bullish momentu
Has the Japanese Yen Reached Its Bottom?
U.S. and Japanese government bonds have recently come under heavy selling pressure. Paradoxically, rising risk aversion has instead fueled golds bullish momentum, with prices now firmly breaking above the USD 4,800 per ounce level.
Investors should pay close attention to the short-term market logic currently at play. The simultaneous sell-off in U.S. Treasuries, the U.S. dollar, and equities reflects growing concerns over the fiscal debt burdens of both the United States and Japan, prompting investors to reduce exposure to U.S. dollar-denominated assets.
As highlighted in our commentary yesterday, the 2.5% yield level on the Japanese 10-year government bond serves as a critical threshold. A decisive move above this level would signal the emergence of a much broader capital reallocation wave.
")
(Chart 1: Japan 10-Year Government Bond Yield | Source: CNBC)Yen Dynamics Under Systemic Risk
Traditionally regarded as a safe-haven currency, the Japanese yen tends to strengthen during periods of systemic risk as carry trades unwind and leverage is reduced. As yield differentials between sovereign bonds across countries narrow, the opportunity cost of fixed-income investments shifts.
From this perspective, Japanese life insurance companies may repatriate overseas assets back into domestic bonds, a process that would ultimately support yen appreciation rather than depreciation.
Extreme Volatility in Japanese Bonds Spills Over Globally
Regarding the recent sell-off in U.S. and Japanese bond markets, U.S. Treasury Secretary Bessent stated that the Japanese government bond liquidation has spilled over into the U.S. Treasury market. He further noted that Japanese bonds experienced a six-standard-deviation price move.
If asset price movements follow a normal distribution, fluctuations within three standard deviations cover approximately 99.7% of outcomes. A six-standard-deviation event implies an extremely low probability, theoretically around two in one billion, and is widely regarded as a classic “black swan” event.
According to foreign media reports, some traders have indeed sold U.S. Treasuries to re-enter Japanese government bonds.
For example, Gerald Gan, Chief Investment Officer at Singapore-based Reed Capital Partners, remarked that a 27 basis-point yield swing was astonishing, adding:
“The market was so dislocated that I couldnt resist selling some U.S. Treasuries to buy Japanese government bonds.”
Meanwhile, Vincent Chung, a portfolio manager at T. Rowe Price, used the sell-off to rebuild part of his underweight positions:
“When you see dislocations like today, you may consider adding back exposure, because we dont know exactly where the peak will be.”Yen Outlook: Short-Term Base Forming
Traders are effectively betting on potential emergency action by the Bank of Japan and possible bond buybacks by the Ministry of Finance. We believe the yen has likely entered a short-term base-building phase. With official support, upside potential appears greater than downside risk, offering investors a potential opportunity to position near long-term lows.
Liquidity Stress and Gold: A Contrarian Risk
How does liquidity stress affect gold? Our view diverges from prevailing market sentiment. Under liquidity squeeze conditions, some institutions may be forced to sell highly liquid assets, including gold, to meet margin requirements elsewhere. This phenomenon is commonly referred to as a market dislocation effect.
While golds current rally is undeniably aggressive, investors should remain alert to the risk of a sharp pullback driven by forced liquidation rather than fundamental demand.
Gold Technical Analysis
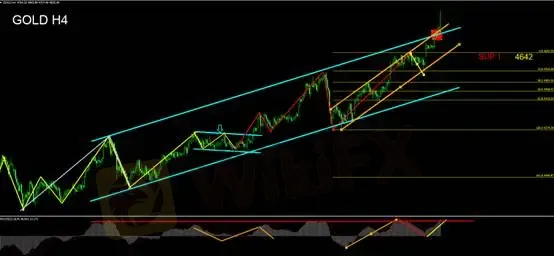
Based on the 4-hour chart, gold has broken above both the medium-term ascending channel (blue) and the short-term ascending channel (orange), entering an overbought zone.
The MACD momentum oscillator also indicates overheating conditions.
Notably, the recent advance has not been driven by fresh buying interest, but rather by a short squeeze.
Long position holders may trail the trend using the 4H 5-period moving average; a break below this level would signal an exit.
Short position holders should recognize the elevated risk of short-covering rallies. Attempting to call the top in a squeeze environment significantly increases the probability of forced liquidation and is therefore not advised.
Trading Strategy
Remain sidelined and observe.
Support Levels
SUP1: 4642
Resistance
No clear resistance at this stage
Risk Disclaimer
The above views, analysis, research, prices, and other information are provided solely as general market commentary and do not represent the position of this platform. All readers assume full responsibility for their own risk. Please trade with caution.
Disclaimer:
Le opinioni di questo articolo rappresentano solo le opinioni personali dell’autore e non costituiscono consulenza in materia di investimenti per questa piattaforma. La piattaforma non garantisce l’accuratezza, la completezza e la tempestività delle informazioni relative all’articolo, né è responsabile delle perdite causate dall’uso o dall’affidamento delle informazioni relative all’articolo.
WikiFX Trader
TICKMILL
Sotto supervisione
FXTM
Sotto supervisione
EC markets
Sotto supervisione
vantage
Sotto supervisione
TMGM
Sotto supervisione
VT Markets
Sotto supervisione
TICKMILL
Sotto supervisione
FXTM
Sotto supervisione
EC markets
Sotto supervisione
vantage
Sotto supervisione
TMGM
Sotto supervisione
VT Markets
Sotto supervisione
Rate Calc
USD

CNY
Tasso di cambio attuale:0
inserisci l'importo
USD
A disposizione
CNY
Calcolare 