
Broker Globale Piattaforma di Verifica Regolamentare
WikiFX
English
简体中文
繁體中文
English
Pусский
日本語
ภาษาไทย
Tiếng Việt
Bahasa Indonesia
Español
हिन्दी
Filippiiniläinen
Français
Deutsch
Português
Türkçe
한국어
العربية
Headwinds Everywhere: Cooling Elevated Valuations
Sommario:As the title suggests, markets have entered a period of consolidation this week. Whether it is escalating tensions between the U.S. and Europe over Greenland or growing political instability in Japan,
As the title suggests, markets have entered a period of consolidation this week. Whether it is escalating tensions between the U.S. and Europe over Greenland or growing political instability in Japan, a series of clear negative catalysts has begun to cool elevated valuations across global capital markets.
According to FactSets Earnings Insight released on January 16, using a forward 12-month price-to-earnings methodology, the S&P 500 is currently trading at 22.2x earnings, above its 5-year average of 20x and 10-year average of 18.8x.
We believe that as the economic cycle settles into a Goldilocks phase, U.S. equities are most likely to trade within an 18–22x forward P/E range over the next year. In other words, the outlook for 2026 hinges on whether AI can be effectively integrated into production, workflows, and daily life, generating tangible productivity gains to justify current valuations.
At present, elevated valuations largely reflect expectations of future benefits. However, if corporate earnings fail to deliver and a gap emerges between expectations and reality, investor sentiment could deteriorate rapidly, becoming the primary catalyst for a market correction. Should a medium-term pullback occur, we would view it as an attractive opportunity for tactical accumulation.
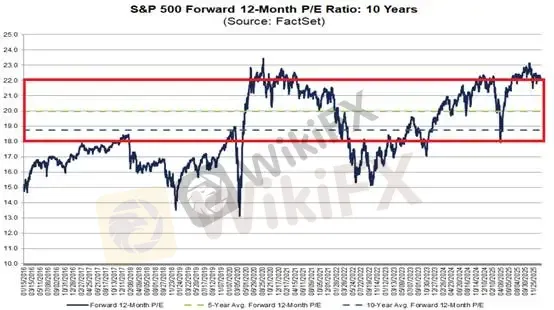
(Figure 1. S&P 500 Forward 12-Month Price-to-Earnings Ratio; Source: FactSet)
Europe‘s ACI: A High-Impact Policy Weapon
The EU’s Anti-Coercion Instrument (ACI) represents a highly disruptive tool for global capital markets. Leaders such as French President Emmanuel Macron have called for activating the ACI in response to U.S. actions.
That said, market participants largely believe the U.S. and Europe are engaged in a TACO-style negotiation over Greenland, which helps explain why the issue has had limited short-term impact on market volatility.
Japan‘s Political Shockwaves and the Global Bond Sell-Off
In contrast, Japan’s political turmoil has had far-reaching global consequences. As a general rule, when uncertainty rises, capital moves first to selling, waiting for clarity before re-entering risk positions.
Both U.S. 10-year Treasuries and Japanese 10-year government bonds (JGBs) have come under heavy selling pressure, signaling that traditional safe-haven bonds are temporarily losing investor favor.
We recommend closely monitoring the 2.5% yield level on Japan‘s 10-year JGB as a critical threshold. A sustained break above this level could intensify selling pressure in U.S. Treasuries. As the world’s largest creditor nation, Japans domestic rate volatility can trigger large-scale global capital reallocations, with meaningful implications for broader financial markets.
")
(Figure 2. Japan 10-Year Government Bond Yield; Source: CNBC)
")
(Figure 3. U.S. 10-Year Treasury Yield; Source: CNBC)Gold Surge Driven by Yen Dynamics
We believe the recent surge in gold prices has been significantly supported by yen weakness. Investors are increasingly positioning for a potential capital repatriation shock should Japans 10-year yield decisively break above 2.5%, a scenario that could trigger a broader risk-off event or even a black swan for global markets.
That said, if tensions subside after February 8, the fundamental justification for golds elevated price levels could quickly fade.
Gold Technical Analysis
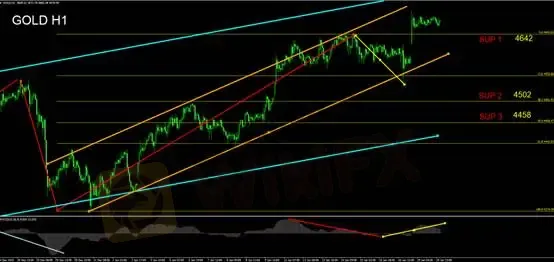
Building on yesterdays price action, gold stabilized after retesting the lower boundary of the orange channel. The current consolidation suggests a correction through time rather than price, allowing momentum divergence to normalize. Prices remain firmly above USD 4,642 per ounce, prompting us to shift our short-term bias to neutral-to-bullish.
Following a breakout above the Fibonacci 1.618 extension, gold continues to register new highs, leaving no clearly defined resistance levels. We recommend using moving averages to trail prices.
The MACD oscillator has reversed upward from below the zero line, with positive histogram readings supporting continued bullish momentum.
For intraday strategies, focus on support at the lower boundary of the orange channel. If U.S. session price action tests this level and holds above USD 4,642/oz, traders should watch for long opportunities. Long positions should not impose an upside cap. Once profits exceed USD 30, a breakeven stop may be applied. Suggested stop-loss: USD 4,635. If conditions are not met, remain on the sidelines.
Support 1: 4,642
Support 2: 4,502
Support 3: 4,458
Resistance: New highs; no defined resistance
Risk Disclosure
The views, analyses, research, prices, or other information provided above are for general market commentary only and do not represent the position of this platform. All readers assume full responsibility for their own investment decisions. Please trade with caution.
Disclaimer:
Le opinioni di questo articolo rappresentano solo le opinioni personali dell’autore e non costituiscono consulenza in materia di investimenti per questa piattaforma. La piattaforma non garantisce l’accuratezza, la completezza e la tempestività delle informazioni relative all’articolo, né è responsabile delle perdite causate dall’uso o dall’affidamento delle informazioni relative all’articolo.
WikiFX Trader
WikiFX Trader
Rate Calc
USD

CNY
Tasso di cambio attuale:0
inserisci l'importo
USD
A disposizione
CNY
Calcolare 