
Broker Globale Piattaforma di Verifica Regolamentare
WikiFX
English
简体中文
繁體中文
English
Pусский
日本語
ภาษาไทย
Tiếng Việt
Bahasa Indonesia
Español
हिन्दी
Filippiiniläinen
Français
Deutsch
Português
Türkçe
한국어
العربية
TSMC Raises Capital Expenditure as AI Momentum Remains Strong
Sommario:On the 16th, leading pure-play foundry TSMC held its earnings conference call, reinforcing an optimistic outlook for the semiconductor cycle and announcing a significant increase in capital expenditur
On the 16th, leading pure-play foundry TSMC held its earnings conference call, reinforcing an optimistic outlook for the semiconductor cycle and announcing a significant increase in capital expenditure. The company raised its CAPEX guidance to USD 52–56 billion, well above market expectations, and indicated that capital spending over the next three years will remain above current levels.
Following the briefing, risk assets continued to rally, as TSMCs guidance provided investors with renewed confidence in the sustainability of the AI growth narrative.
Major U.S. Equity Indices Closed Higher
Dow Jones Industrial Average: +0.6%, closing at 49,442.44
S&P 500 Index: +0.26%, closing at 6,944.47
Nasdaq Composite: +0.25%, closing at 23,530.02
Philadelphia Semiconductor Index: +1.76%, closing at 7,837.30
TSMCs CAPEX guidance of USD 52–56 billion exceeded market expectations of USD 45–50 billion, triggering a broad rally in semiconductor equipment stocks. Applied Materials surged 9.36%, KLA rose 8.41%, Lam Research gained 7.92%, and ASML advanced 6.96%.
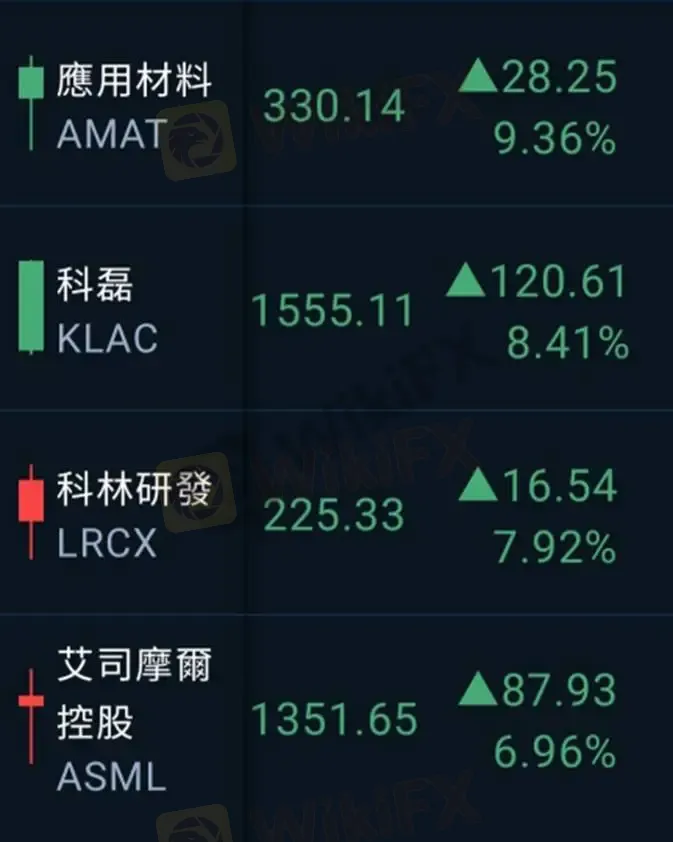
(Figure 1: Semiconductor Equipment Stocks Surge on TSMC CAPEX Upside Surprise; Source: US Stock Dreamer)Analyst Commentary
The Q&A reinforced that AI demand remains robust, while rising memory prices have minimal impact on high-end smartphones and PCs. TSMCs view suggests that consumer electronics demand remains resilient, indicating that higher raw material costs are not materially constraining end-product pricing.
A stable consumer electronics outlook also implies a sustained manufacturing inventory restocking cycle, supporting continued momentum across the broader industrial sector. Collectively, these signals point to a macro environment characterized by strong investment and consumption dynamics.
Market analysts estimate that TSMC plans to build 16 new fab sites between 2026 and 2028. Assuming average CAPEX of approximately USD 12 billion per fab, total CAPEX over this period could approach USD 200 billion. This may mark the beginning of an aggressive CSP procurement cycle starting in 2026, with semiconductor demand expected to rise further rather than plateau.
With macro conditions remaining balanced and industry fundamentals offering strong productivity tailwinds, 2026 appears to be a cycle where “buying the trend” remains the dominant strategy.
Gold Technical Analysis
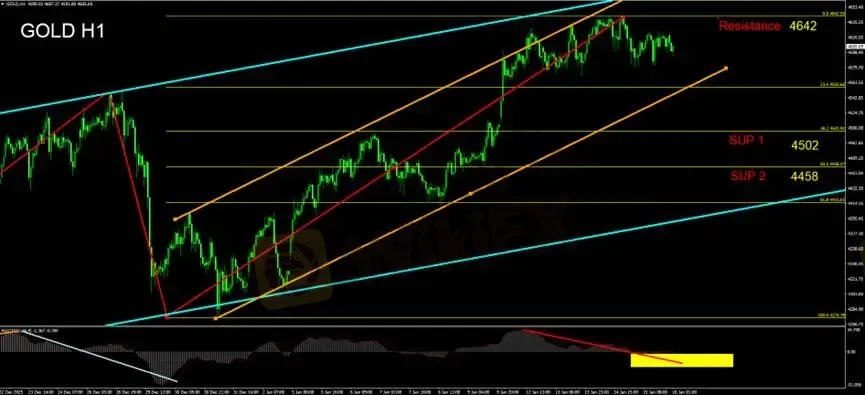
Consistent with our prior assessment, gold prices have reached the Fibonacci extension target at 1.618, corresponding to USD 4,642 per ounce, which we identify as a short-term ceiling.
Prices have now touched the upper boundaries of both the blue and orange channels. From a momentum perspective, traders should remain alert to the risk of a near-term pullback.
The MACD histogram continues to contract. After a day of consolidation, momentum has not re-accelerated higher and remains oscillating around the zero line. As prices move sideways, this supports our view of a bearish divergence between short-term momentum indicators and price action.
At current levels, attempting to call a top and initiate short positions offers limited risk-reward efficiency. A neutral, wait-and-see stance is preferred. For bullish retracements, attention should be focused on the Fibonacci 38.2% and 50% retracement levels as key support zones.
Support Levels
SUP1: 4,502
SUP2: 4,458
Resistance Level
Resistance: 4,642
Risk Disclaimer
All views, analyses, research, price levels, and related information are provided for general market commentary only and do not represent the official position of this platform. Investors should assume full responsibility for their own decisions and exercise caution when trading.
Disclaimer:
Le opinioni di questo articolo rappresentano solo le opinioni personali dell’autore e non costituiscono consulenza in materia di investimenti per questa piattaforma. La piattaforma non garantisce l’accuratezza, la completezza e la tempestività delle informazioni relative all’articolo, né è responsabile delle perdite causate dall’uso o dall’affidamento delle informazioni relative all’articolo.
WikiFX Trader
WikiFX Trader
Rate Calc
USD

CNY
Tasso di cambio attuale:0
inserisci l'importo
USD
A disposizione
CNY
Calcolare 