
Broker Globale Piattaforma di Verifica Regolamentare
WikiFX
English
简体中文
繁體中文
English
Pусский
日本語
ภาษาไทย
Tiếng Việt
Bahasa Indonesia
Español
हिन्दी
Filippiiniläinen
Français
Deutsch
Português
Türkçe
한국어
العربية
Why Equity Markets Keep Hitting Record Highs: A Liquidity-Driven Market
Sommario:According to a recent weekly report from Yuanta Investment Consulting, the current elevated valuations across global financial markets are not the result of irrational exuberance. Instead, they reflec
According to a recent weekly report from Yuanta Investment Consulting, the current elevated valuations across global financial markets are not the result of irrational exuberance. Instead, they reflect what Yuanta describes as a “fragile equilibrium” driven by excessive liquidity.
Yuanta argues that the sharp surge in asset prices cannot be adequately explained by fundamentals alone. As shown in Figure 1, the inflation-adjusted Shiller Price-to-Earnings (CAPE) ratio smooths out business cycle noise and provides a clearer view of valuation levels. Based on December data, the U.S. equity markets Shiller P/E has risen to 39.42, far above the long-term average of 17.68, and second only to the peak reached during the September 2000 dot-com bubble.
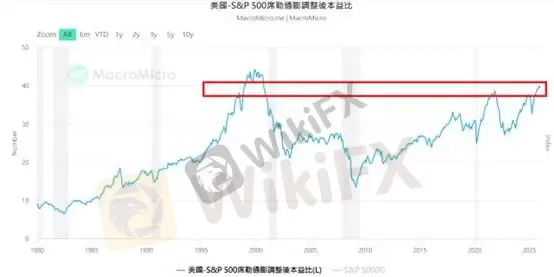
(Figure 1. S&P 500 Inflation-Adjusted Shiller P/E Ratio; Source: MacroMicro)
Overvaluation is not limited to the U.S. market. With the exception of Japan, whose equity valuations remain below historical averages, markets in South Korea, Europe, and China are all trading above long-term valuation norms. This highlights that elevated valuations are a global phenomenon, rather than the result of capital concentrating in a single market.
Yuanta further examines the ratio of global equity market capitalization to global M2 money supply, which currently stands at 130.9%, roughly equivalent to levels seen in 2005. In simple terms, this suggests that todays asset prices may not be as inflated as commonly perceived.
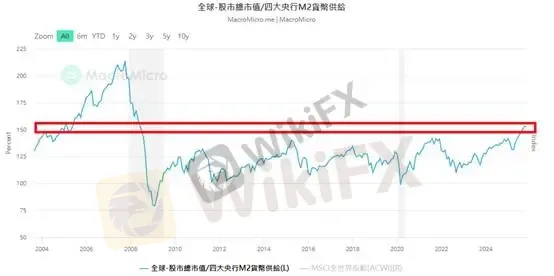
(Figure 2. Global Equity Market Capitalization / Global M2; Source: MacroMicro)
A deeper look at monetary expansion shows that between 2007 and 2025, global M2 expanded from USD 43.7 trillion to USD 108.5 trillion, while global GDP grew by only 99.1% over the same period. The nearly 50-percentage-point gap between money supply growth and real economic expansion is a critical driver of asset pricing.
This divergence reflects the fact that excess liquidity is primarily channeled into stores of value, such as bonds, equities, and other financial assets. When global central banks create money beyond the needs of real economic transactions, surplus liquidity is forced into financial markets, lifting asset prices across the board. In this context, high valuation multiples are essentially a mechanism for absorbing excess capital.
While it may appear that aggressive U.S. monetary expansion is the primary driver behind global asset inflation, Yuanta argues that China has played a more significant role. Since 2015, amid political uncertainty and a pessimistic domestic outlook, China has accumulated approximately USD 7.5 trillion in foreign exchange inflows. However, its official foreign exchange reserves have declined by nearly USD 600 billion, creating an USD 8.1 trillion gap.
This capital has sought refuge and investment opportunities in international financial markets, generating spillover effects that have supported U.S. equities and lifted global asset prices.
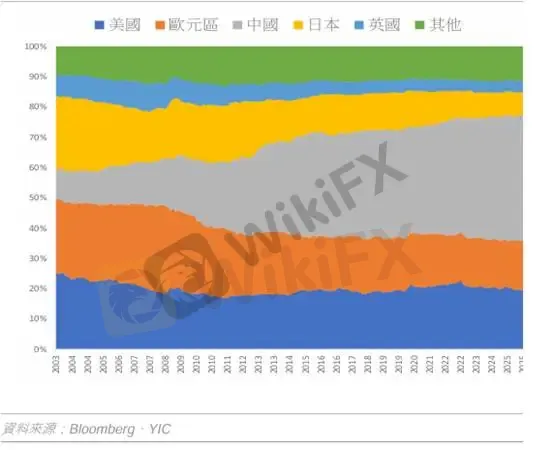
(Figure 3. Since 2007, Chinas Share of Global M2 Growth Has Risen from 27.4% to 41.7%; Source: Yuanta Investment Consulting)
Three Key Signals to Monitor for a Valuation Correction
After identifying the root causes, Yuanta outlines three indicators investors should monitor as potential signals of a correction under high valuation conditions:
An uncontrolled surge in U.S. Treasury yields
An unusually rapid accumulation of Chinas foreign exchange reserves
A significant narrowing of Chinas trade surplus
From our perspective, we agree that global liquidity excess and M2 expansion have been key drivers behind the rise in gold prices. However, we do not believe that excess liquidity itself is currently a cause for panic. Moreover, the likelihood of the above three factors triggering a structural market break appears relatively low, unless the global economy enters a recession, which could shift markets toward a “cash-is-king” environment.
In short, as long as recession risks remain contained, a simultaneous sell-off in equities, bonds, and gold should be interpreted as a market dislocation, rather than a systemic crisis, potentially presenting investors with another strategic entry opportunity.
Risk Disclosure
The views, analyses, research, prices, and other information provided above are for general market commentary only and do not represent the position of this platform. All readers assume full responsibility for their own investment decisions. Please exercise caution when trading.
Disclaimer:
Le opinioni di questo articolo rappresentano solo le opinioni personali dell’autore e non costituiscono consulenza in materia di investimenti per questa piattaforma. La piattaforma non garantisce l’accuratezza, la completezza e la tempestività delle informazioni relative all’articolo, né è responsabile delle perdite causate dall’uso o dall’affidamento delle informazioni relative all’articolo.
WikiFX Trader
HFM
Sotto supervisione
FXTM
Sotto supervisione
GO Markets
Sotto supervisione
IC Markets Global
Sotto supervisione
D prime
Supervisione del paese
EBC FINANCIAL GROUP
Sotto supervisione
HFM
Sotto supervisione
FXTM
Sotto supervisione
GO Markets
Sotto supervisione
IC Markets Global
Sotto supervisione
D prime
Supervisione del paese
EBC FINANCIAL GROUP
Sotto supervisione
Rate Calc
USD

CNY
Tasso di cambio attuale:0
inserisci l'importo
USD
A disposizione
CNY
Calcolare 