
Broker Globale Piattaforma di Verifica Regolamentare
WikiFX
English
简体中文
繁體中文
English
Pусский
日本語
ภาษาไทย
Tiếng Việt
Bahasa Indonesia
Español
हिन्दी
Filippiiniläinen
Français
Deutsch
Português
Türkçe
한국어
العربية
Labor Market Softens, but Risks Remain Contained
Sommario:U.S. Nonfarm Payrolls (December): +50,000 jobsUnemployment Rate: 4.4%Labor Force Participation Rate: 64.4%Average Hourly Earnings (YoY): +3.76%(Figure 1. December Nonfarm Payrolls and Unemployment Rat
U.S. Nonfarm Payrolls (December): +50,000 jobs
Unemployment Rate: 4.4%
Labor Force Participation Rate: 64.4%
Average Hourly Earnings (YoY): +3.76%
(Figure 1. December Nonfarm Payrolls and Unemployment Rate | Source: BLS)
Key Characteristics of a Goldilocks Economy
Moderate Economic Growth: GDP continues to expand, but not at a pace that fuels asset bubbles.
Low and Stable Inflation: Price pressures remain contained, reducing the need for aggressive monetary tightening.
Low Unemployment: The labor market remains healthy without becoming excessively tight and triggering a wage–price spiral.
A Closer Look at the Structure of Unemployment
Unemployment Duration < 5 Weeks: Stable at approximately 2.2 million individuals
Unemployment Duration 5–14 Weeks: Slightly above 2.0 million
Long-Term Unemployment (>15 Weeks): Elevated, remaining above 3.0 million since September last year
(Figure 2. Unemployment Duration Trends | Source: MacroMicro)
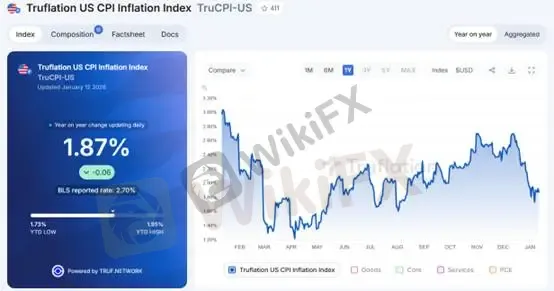
- (Figure 3. High-Frequency Inflation Data Leading CPI by Approximately Two Months | Source: Truflation.com)
Key Levels
Support 1: 4,500
Support 2: 4,549
Target / Resistance: 4,638
")
Beyond the modest headline payroll growth, the decline in the unemployment rate from 4.5% to 4.4% suggests that the prior uptick was largely driven by one-off effects, particularly separations related to government employment. This indicates that the U.S. labor market has not experienced a structural deterioration.
From a macro perspective, the key focus of this report lies in the interaction between wage growth and inflation dynamics. While wage growth has continued to accelerate, inflation data has softened, with U.S. CPI for November reported at 2.71%. This divergence implies a gradual improvement in real purchasing power. Taken together, the U.S. economy currently appears to be operating within a “Goldilocks” environment.
")
Current conditions indicate that the time required to secure a new job has lengthened. This is primarily driven by firms reducing hiring openings or raising recruitment standards, rather than engaging in large-scale layoffs. Corporate behavior suggests a preference for hiring freezes or leaving vacancies unfilled, rather than active downsizing.
According to high-frequency inflation data from Truflation (Figure 3), U.S. inflation remains on a downward trajectory, though it has yet to fully stabilize. Historically, this dataset tends to lead official CPI releases by one to two months, making it a useful reference for monetary policy expectations. We expect inflation to continue cooling after the one-off tariff-related impact fades.
While this employment report does not materially alter market expectations for a January rate cut, the broader inflation trend points to a structural disinflationary momentum. Should this trend persist into the second half of the year, the Federal Reserve may be compelled to ease its inflation management stance. Current market pricing implies two rate cuts this year, with the possibility of expanding to three to four cuts.
Gold: Technical Analysis
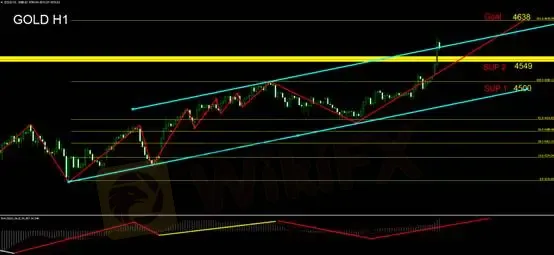
On the hourly chart, gold prices stabilized after pulling back to the Fibonacci 50% neutral support level at USD 4,411 per ounce. The bullish trend subsequently resumed, pushing prices to a new swing high and confirming the onset of a second upward leg.
Based on Fibonacci extensions, the 1.618 projection implies an upside target at USD 4,638 per ounce.
Oscillator-style MACD signals indicate that after the pullback to 4,411, the histogram reversed higher, driving the MACD line from negative into positive territory. This aligns with the two bullish conditions previously outlined, reinforcing a long-biased trading stance.
For intraday positioning, long entries may be considered near the prior high-turned-support level at USD 4,549.54 per ounce. A pullback toward this level could offer opportunities to establish long positions. However, if gold rallies directly toward the target without meaningful retracements, investors should remain sidelined and avoid chasing prices.
Attention should be paid to potential divergences between daily candlestick patterns and oscillator indicators. If the next daily candle closes bearish, a second bearish divergence may emerge, signaling waning upside momentum and limited follow-through. Long positions should therefore be managed with heightened caution.
Suggested Stop Loss: USD 20
Risk Disclaimer:
The views, analyses, research, price levels, and other information provided above are for general market commentary only and do not represent the position of this platform. All readers assume full responsibility for their own investment decisions. Please trade with caution.
Disclaimer:
Le opinioni di questo articolo rappresentano solo le opinioni personali dell’autore e non costituiscono consulenza in materia di investimenti per questa piattaforma. La piattaforma non garantisce l’accuratezza, la completezza e la tempestività delle informazioni relative all’articolo, né è responsabile delle perdite causate dall’uso o dall’affidamento delle informazioni relative all’articolo.
WikiFX Trader
Exness
Sotto supervisione
D prime
Supervisione del paese
EBC FINANCIAL GROUP
Sotto supervisione
eightcap
Sotto supervisione
XM
Sotto supervisione
ZFX
Sotto supervisione
Exness
Sotto supervisione
D prime
Supervisione del paese
EBC FINANCIAL GROUP
Sotto supervisione
eightcap
Sotto supervisione
XM
Sotto supervisione
ZFX
Sotto supervisione
Rate Calc
USD

CNY
Tasso di cambio attuale:0
inserisci l'importo
USD
A disposizione
CNY
Calcolare 