
Applicazione di richiesta di informazioni sulla regolamentazione dei broker globali
WikiFX
English
简体中文
繁體中文
English
Pусский
日本語
ภาษาไทย
Tiếng Việt
Bahasa Indonesia
Español
हिन्दी
Filippiiniläinen
Français
Deutsch
Português
Türkçe
한국어
العربية
DBG Markets: Market Report for Dec 12, 2025
Sommario:Jobless Shock Signals Fed Dovish Pivot; Dollar Breaks Down, Gold SurgesThe primary story today is the forceful market reaction to the Federal Reserves policy statement. Despite containing certain hawk
Jobless Shock Signals Fed Dovish Pivot; Dollar Breaks Down, Gold Surges
The primary story today is the forceful market reaction to the Federal Reserve's policy statement. Despite containing certain "hawkish cut" elements, the statement was ultimately perceived as overwhelmingly supportive of further monetary easing.
This dovish interpretation, catalyzed by surprisingly sluggish labor market data, triggered a major risk-on shift across global markets.
Post-FOMC & Job Data Fallout
Although the Fed's cut included hawkish signals, the central bank's explicit emphasis on the weakening labor market was viewed as a foundational dovish pivot. This dovish assessment was strongly confirmed following the release of the disappointing US Initial Jobless Claims data:
· The weekly jobless claims surged to 236K, markedly higher than the 220K estimate and the prior week's 192K.
· This was the largest weekly increase since 2020, powerfully reinforcing the "cooling labor market" narrative and escalating dovish bets on the Fed's future path.
In addition to the rate decision, the Federal Reserve's announcement to resume T-bill purchases further pressured the U.S. Dollar.
· The purchase officially begins today, December 12, 2025. The program is designed to support market liquidity, stabilize short-term funding markets, rebuild diminished reserves, and ensure the central bank maintains precise control over its interest rate target system.
· The Fed announced a plan to acquire approximately $40 billion worth of short-dated T-bills per month, with today's inaugural operation scheduled for a size of $8.167 billion.
This substantial injection of liquidity from the T-bill purchases compounds the pressure on the U.S. Dollar.
U.S. Dollar (DXY) Enters Bearish Trend
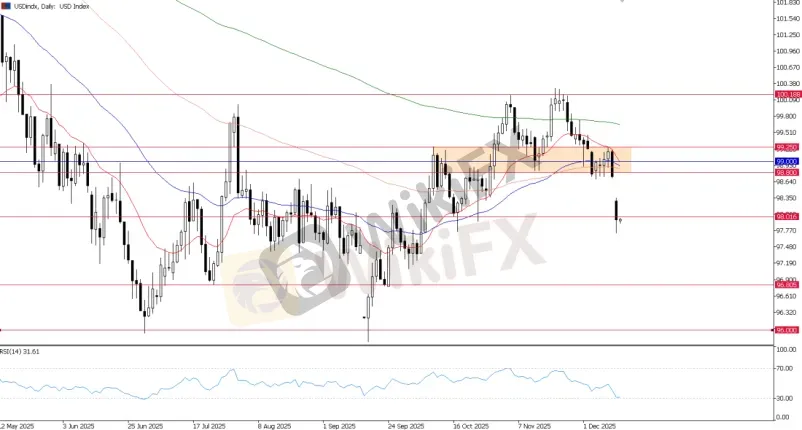
USD Index, Daily Chart
The breach below the 98.80 level fundamentally signals that the recent bullish consolidation has reversed into a bearish trend. While the 98.00 support may offer some near-term stability, it is unlikely to alter the overall direction, with 98.80 now firmly established as the key resistance zone.
Gold: Breakout Rally?
Following the Federal Reserve's decision and the clear weakening signal from the jobless claims data, Gold has successfully surged to a six-week high, confirming that the prior consolidation phase has been broken decisively.
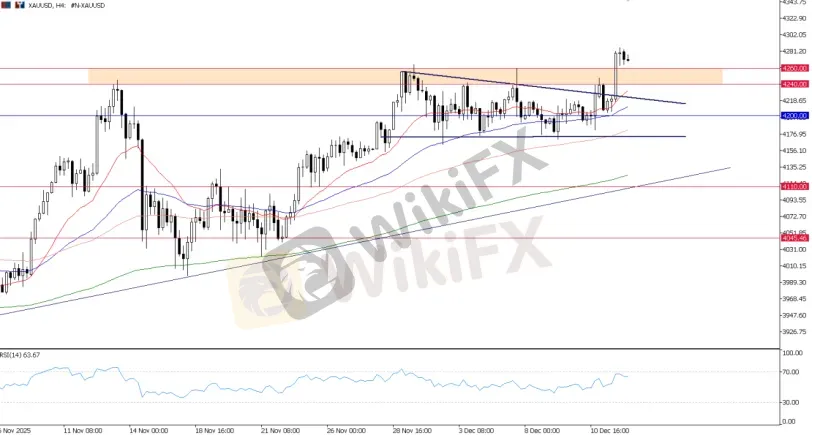
XAU/USD, H4 Chart
With the price now firmly breaking above the key $4,240 – $4,260 resistance zone, the immediate focus shifts to confirming the sustainability of this breakout to support a continued extension of the bullish rally.
U.S. Indices: Value Breaks Records as Tech Faces Scrutiny
The primary drivers today are the distinct split in performance among major U.S. indices, driven by market rotation and concerns over tech profitability following the Federal Reserve's policy pivot.
Following the FOMC's confirmed move to monetary easing, a notable structural rotation is underway, favoring cyclical and value sectors:
· The S&P 500 and Dow Jones Industrial Average surged to all-time record closing highs s capital shifted toward financial, health care, and industrial stocks that benefit from an improving economic outlook and potential easing cycle.
· The Nasdaq 100 failed to move higher and finished lower, remaining under pressure. This divergence is attributed to rising concerns over AI profitability—specifically, the sell-off in major AI-related stocks
Nasdaq 100 Outlook and Technical Focus
The broad outlook for the stock market remains positive, anchored by expectations of continued monetary easing, and the overall upside is likely to extend. However, a cautious stance is warranted against any 'sell-the-news' event or over-optimism that could trigger a short-term pullback.
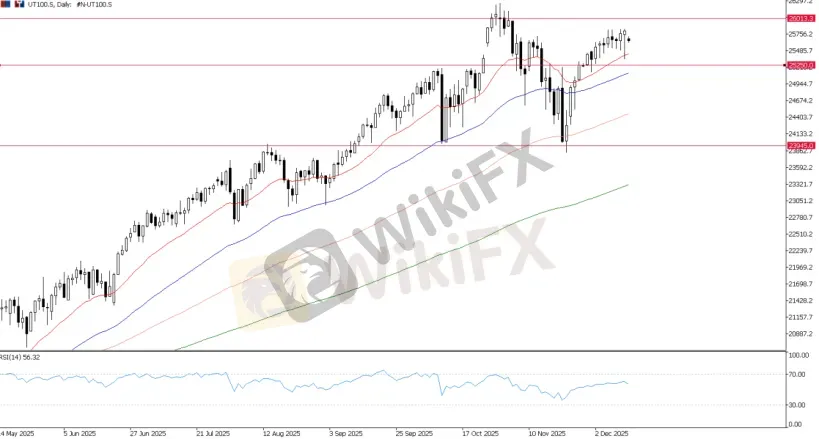
UT100 (Nasdaq), Daily Chart
For the Nasdaq 100, the critical technical level to watch is 25250. If the 25250 support fails to hold firm, it could signal a short-term pullback. A sustained decline in the Nasdaq would subsequently exert pressure on the record-breaking S&P 500 and Dow Jones indices, potentially leading to a synchronized market correction.
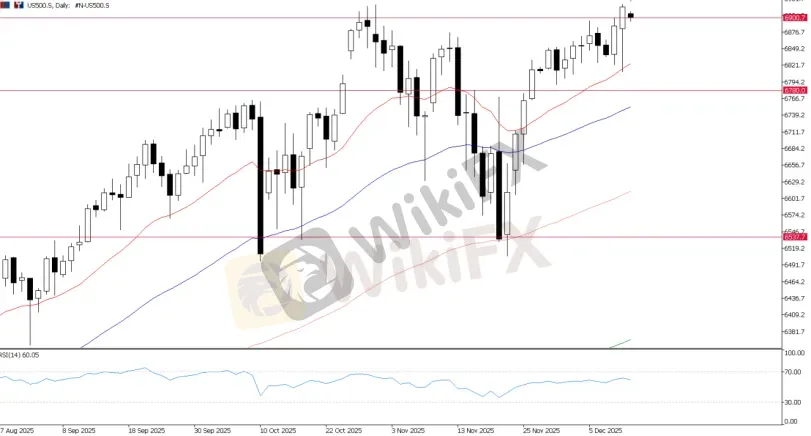
US500, Daily Chart
The S&P 500 (US500) has recently closed at a record high. The immediate focus is on whether the 6900 psychological level can hold firm. Should the index fail to maintain momentum above this level, it could trigger a short-term pullback driven by profit-taking.
Bottom Line
The surge of US Initial Jobless Claims since 2020 served as the ultimate confirmation of the Fed's dovish pivot, fundamentally triggering a major shift across global assets:
the Dollar Index collapsed below the critical 98.80 support, confirming a short-term bearish trend; simultaneously, Gold completed a definitive breakout above the $4,300 level.
This liquidity-driven move has accelerated a structural rotation within equities, where the S&P 500 and Dow Jones posted record highs on value and cyclical strength, even as the Nasdaq 100 struggled amid renewed concerns over the profitability of high-flying AI stocks.
Disclaimer:
Le opinioni di questo articolo rappresentano solo le opinioni personali dell’autore e non costituiscono consulenza in materia di investimenti per questa piattaforma. La piattaforma non garantisce l’accuratezza, la completezza e la tempestività delle informazioni relative all’articolo, né è responsabile delle perdite causate dall’uso o dall’affidamento delle informazioni relative all’articolo.
WikiFX Trader
WikiFX Trader
Rate Calc
USD

CNY
Tasso di cambio attuale: 0
inserisci l'importo
USD
A disposizione
CNY
Calcolare