

Global Broker Regulation Inquiry App
About WikiFX
English
简体中文
繁體中文
English
Pусский
日本語
ภาษาไทย
Tiếng Việt
Bahasa Indonesia
Español
हिन्दी
Filippiiniläinen
Français
Deutsch
Português
Türkçe
한국어
العربية
اردو
DBG Markets: Market Report for July 7, 2026
Abstract:Technical Play in Focus as Markets Await Next Catalyst US Dollar, EURUSD, Gold US Indices AnalysisMarkets Keep Post-NFP MomentumUS stock markets finished strongly higher on Monday, keeping up the pos

Technical Play in Focus as Markets Await Next Catalyst
US Dollar, EURUSD, Gold & US Indices AnalysisMarkets Keep Post-NFP Momentum
US stock markets finished strongly higher on Monday, keeping up the positive momentum from last week's weak jobs report. A massive wave of buying pushed the Dow Jones Industrial Average to an extended record high, closing above the 53,000 mark for the first time in history. While the tech-heavy Nasdaq 100 also climbed, its upward moves remained limited as it hit key technical resistance levels.
Technical Outlook & Major Trading Zones
US Dollar Index Outlook
Our view on the US dollar remains unchanged. The currency continues to feel the pressure from last week's soft jobs data and is expected to stay stuck inside a tight 100.00 – 101.00, or more precisely, 100.30 – 100.80 range for now.
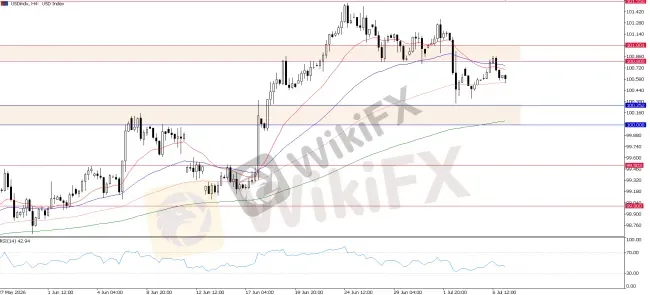
USD Index, H4 Chart
Expect the greenback to move within these boundaries until fresh news arrives.
Gold Outlook: Bulls, But $4,100 Dip Likely
After its explosive breakout above $4,100 last week, the spot gold market is cooling down as short-term traders take their profits while it tests the $4,200 major resistance zone now.
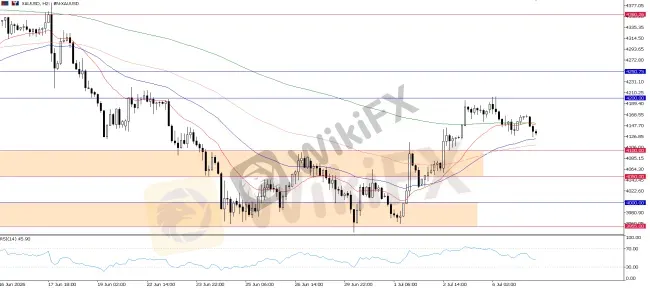
XAUUSD, H4 Chart
We expect further pullbacks in gold today as the price eases off its recent highs. The main focus now shifts to the critical support zone between $4,050 and $4,100. As long as buyers can defend this floor during the current pullback, the short-term upward trend remains healthy.
EUR/USD Analysis: Bullish Reversal Intact
The Euro remains steady against the US dollar, protecting its recent breakout gains even as the greenback stabilizes. Technically, the EUR/USD chart pattern still points toward the bullish reversal that we covered earlier.
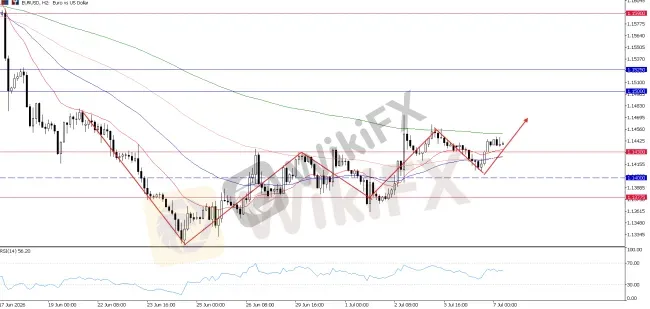
EURUSD, H4 Chart
The short-term upward reversal structure for EUR/USD is completely intact. The currency pair is holding its ground firmly above the critical 1.1400 support level. Although its upward momentum is temporarily capped because the US dollar is moving sideways, the technical setup still favors more upside.
US Indices Analysis: Correction Phase
While the Dow Jones continues to set record highs, both the S&P 500 and Nasdaq 100 Index still track the gains but remain relatively contained at this point. This comes as we see continued profit-taking on high-valuation tech and rotation into value stock sectors.
S&P 500 (US500)
The broad market index moved higher on Monday but remains trapped inside a long-term chart formation.
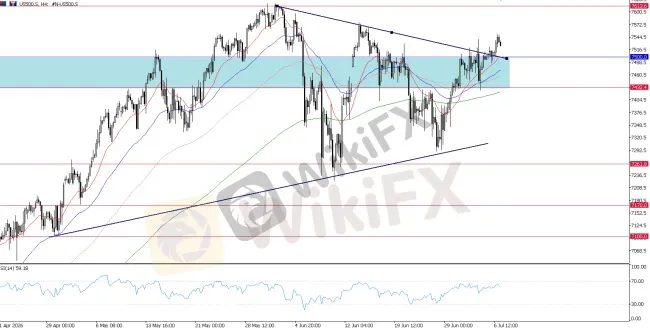
US500, H4 Chart
The S&P 500 is trading right inside a well-defined converging triangle pattern. For today's session, keep a close watch on the key 7,500 level. If the index can hold above 7,500, it will likely gain quick short-term upward momentum for a breakout. If it fails, expect the index to stay stuck in a choppy, range-bound pattern.
Nasdaq 100 (UT100)
While the tech index finished in positive territory, sector rotation continues to limit its upside potential.
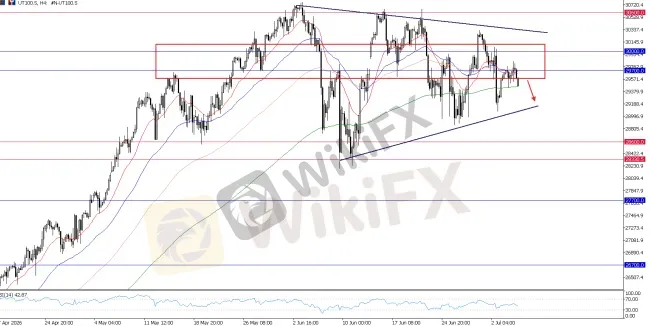
UT100, H4 Chart
The Nasdaq 100 is still struggling under a heavy supply zone. The area between 29,700 and 30,000 remains the key technical resistance ceiling.
As investors continue to rotate money out of big tech and into value sectors, the index will likely face steady overhead pressure and stay trapped in a sideways consolidation phase for now.
Bottom Line & Asset Summary
The financial markets are carrying forward last week's positive momentum, but the lack of new economic data is keeping overall trading light today. While the Dow Jones managed a historic close above 53,000, both the S&P 500 and Nasdaq 100 are trapped under tough technical ceilings due to sector rotation out of big tech. With the US dollar staying stable in a tight range, alternative assets like gold are seeing healthy short-term pullbacks as the market waits for the next big catalyst.
· US Dollar Index: Neutral/Consolidation; capped inside a tight 100.30 – 100.80 pocket beneath the flipped 101.00 resistance ceiling.
· Gold: Short-term Pullback; easing off its recent highs near $4,200 with eyes on the main $4,050 – $4,100 support zone for buying opportunities.
· EUR/USD: Bullish Bias; holding steady above the vital 1.1400 support floor with its short-term upward reversal structure completely intact.
· S&P 500 (US500): Neutral/Rangebound; moving inside a converging triangle pattern, with immediate momentum depending on a hold above 7,500.
· Nasdaq 100 (UT100): Correction Phase; tech upside remains capped under the heavy 29,700 – 30,000 resistance zone as capital active rotates into value sectors.

Disclaimer:
The views in this article only represent the author's personal views, and do not constitute investment advice on this platform. This platform does not guarantee the accuracy, completeness and timeliness of the information in the article, and will not be liable for any loss caused by the use of or reliance on the information in the article.
WikiFX Broker
Latest News
StoneX Review 2026: Should You Trade with This Broker?
 WikiFX
Yen Firms While Dollar Pauses
WikiFXGFS Review 2026: Withdrawal Complaints, Weak Regulation Data, and Account Access Risks
WikiFXTRANS X MARKETS Review 2026: Unregulated Status and Serious Withdrawal Complaints
WikiFXRyvoTrade Review 2026: Unregulated Status and Withdrawal Complaints
WikiFXPhillip Nova Review 2026: Should You Trade with This Broker?
WikiFXThinking About KATOPRIME? What Every Trader Should Know Before Depositing Funds
WikiFXYour Backtesting Results Mean Nothing If You Ignore This One Live Trading Reality
WikiFXOver US$2.9 Million Saved: Singapore's Crypto Scam Crackdown Sends a Warning to Malaysian Investors
WikiFXHow Pig Butchering Scams Drain Beginner Trading Accounts
WikiFX