

Global Broker Regulation Inquiry App
About WikiFX
English
简体中文
繁體中文
English
Pусский
日本語
ภาษาไทย
Tiếng Việt
Bahasa Indonesia
Español
हिन्दी
Filippiiniläinen
Français
Deutsch
Português
Türkçe
한국어
العربية
اردو

FPG USOUSD Market Report May 25, 2026
Abstract:On the H1 timeframe chart, USOUSD has once again experienced a significant price drop within a relatively short period of time. This time, the price declined sharply from 100.50 to 93.73. Over the pas
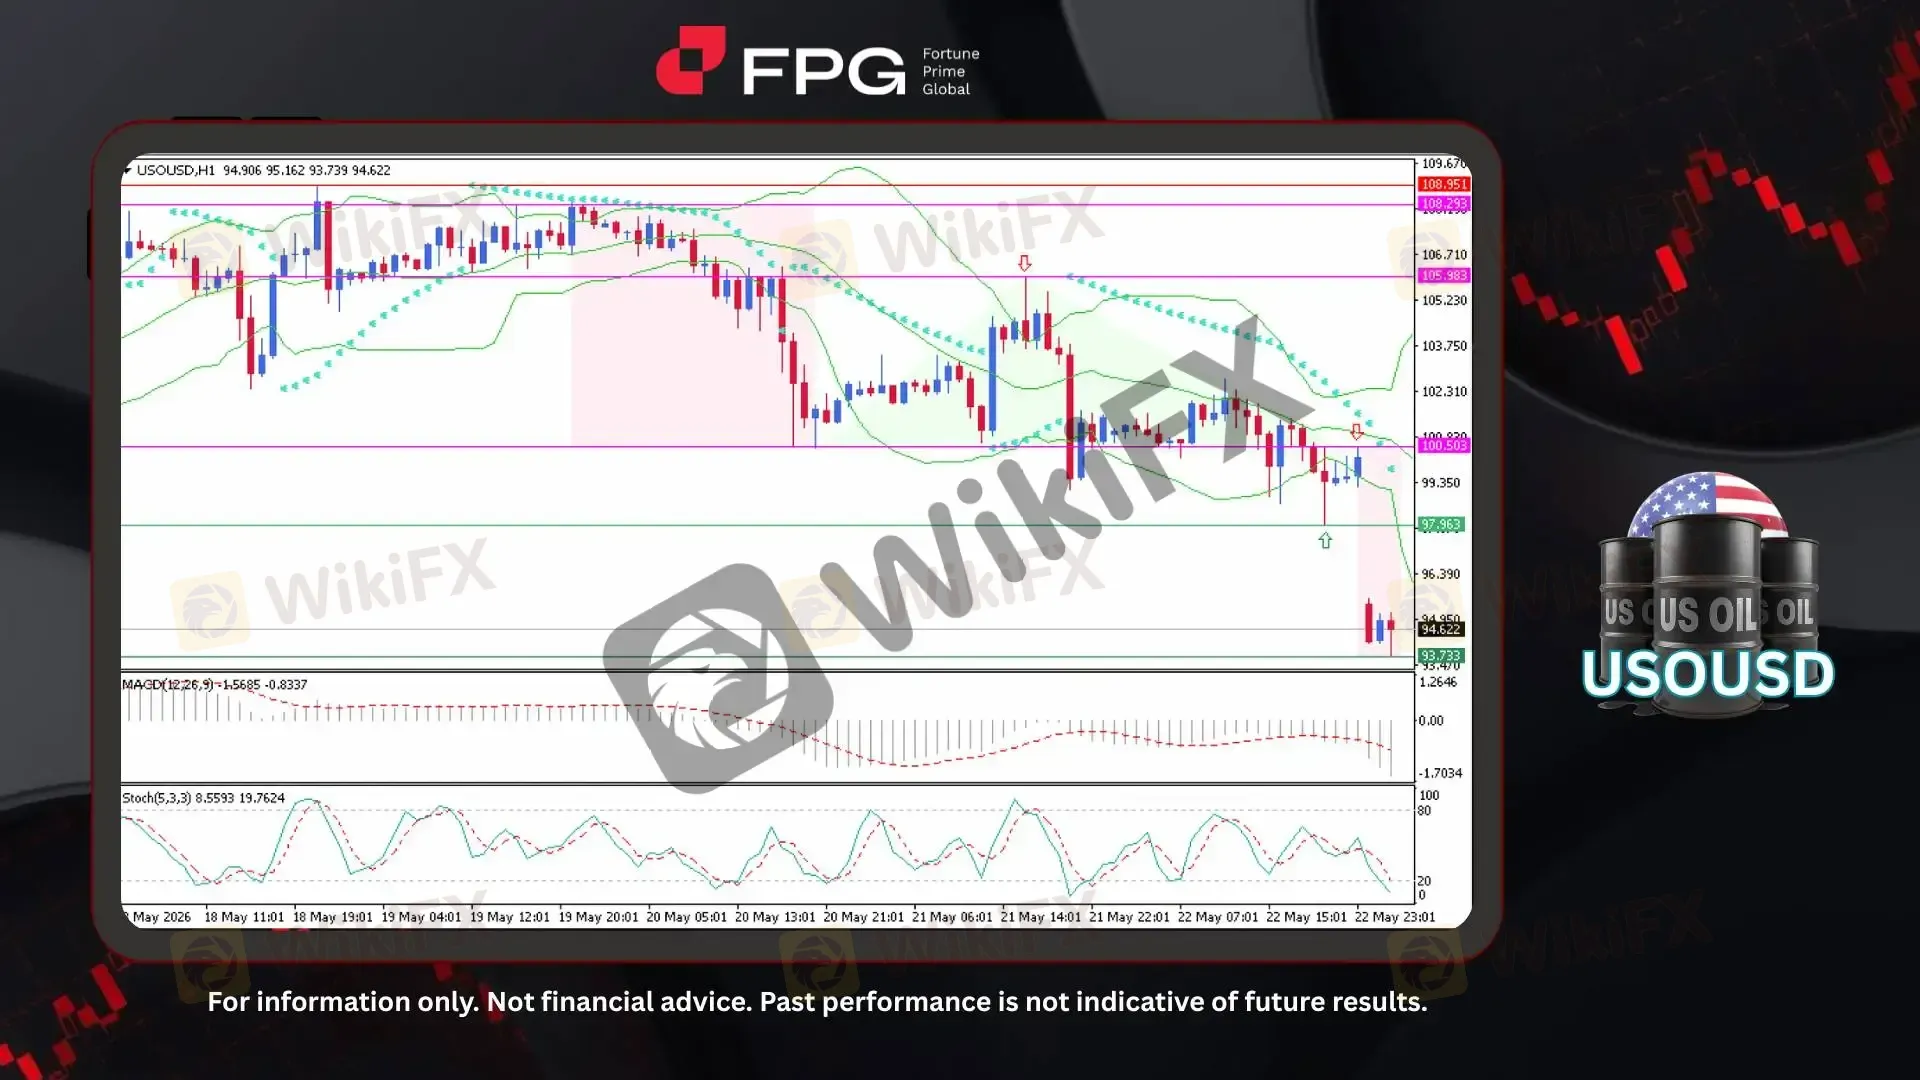
On the H1 timeframe chart, USOUSD has once again experienced a significant price drop within a relatively short period of time. This time, the price declined sharply from 100.50 to 93.73. Over the past two weeks, the market has remained highly volatile with a bearish tendency, reflected by multiple price rejection areas that have formed as resistance zones. The current price is trading around 94.62, with volatility still remaining relatively high.
From a technical perspective, the overall market structure still indicates strong bearish momentum following the recent breakdown below the key 100.50 support area. The Parabolic SAR remains positioned above the current candles, confirming that selling pressure is still dominating the short-term trend. Meanwhile, the Bollinger Bands have expanded significantly, signaling elevated market volatility after the sharp decline. The MACD indicator also continues to move in negative territory with bearish momentum still visible, while the Stochastic oscillator remains near the oversold region, suggesting that although temporary rebounds may occur, the broader bearish pressure has not yet fully subsided.
Global oil markets remain volatile as investors closely monitor potential easing of sanctions on Iranian oil exports, shifting OPEC+ production policies, and rising geopolitical tensions across the Middle East. Additional pressure also comes from concerns surrounding global demand, US sanctions targeting Iranian-linked supply chains, and uncertainty over future energy policies among major producing nations. Despite ongoing geopolitical risks, expectations of improving global supply conditions have recently pushed crude oil prices lower across international markets. As a result, USOUSD recently experienced a sharp price decline as traders reacted to the growing possibility of increased oil supply and easing disruption risks.
Technical Market Overview
1. Current Position: USOUSD is currently trading around the 94.62 area after experiencing a sharp bearish decline from the 100.50 resistance zone down to the recent low near 93.73. The market structure on the H1 timeframe remains strongly bearish, with price continuing to trade near the lower range following the recent breakdown.
2. Resistance Zone: The nearest resistance zone is located around 100.50. Additional higher resistance can be seen around 105.98, where multiple previous price rejections occurred during earlier recovery attempts.
3. Support Zone: The immediate support zone is currently positioned around 93.73 as the latest swing low. If bearish pressure continues and this level fails to hold, the market could potentially extend losses toward lower untested support areas.
4. Indicator Observation: Technical indicators continue to reflect dominant bearish momentum. The Parabolic SAR remains above the current candles, confirming the ongoing downtrend structure. Bollinger Bands have widened significantly, indicating elevated volatility after the recent sharp decline. Meanwhile, the MACD remains in negative territory with bearish momentum still visible, while the Stochastic oscillator is moving near oversold conditions, suggesting the possibility of temporary short-term rebounds within the broader bearish trend.
5. Technical Summary: Overall, USOUSD remains under strong bearish pressure following the recent aggressive sell-off. Although short-term technical rebounds may occur due to oversold conditions, the broader market structure still favors bearish continuation unless price manages to recover and stabilize back above the key resistance zones. High volatility is expected to persist as traders continue reacting to both technical developments and global oil market fundamentals.
Market Performance:
Commodities Last Price % Change
UKOUSD 98.92 −5.65%
Today's Key Economic Calendar:
CN: FDI (YTD) YoY
BR: BCB Focus Market Readout
CA: Wholesale Sales MoM (Preliminary)
Risk Disclaimer: This report is for informational purposes only and does not constitute financial advice. Investments involve risks, and past performance does not guarantee future results. Consult your financial advisor for personalized investment strategies.
Disclaimer:
The views in this article only represent the author's personal views, and do not constitute investment advice on this platform. This platform does not guarantee the accuracy, completeness and timeliness of the information in the article, and will not be liable for any loss caused by the use of or reliance on the information in the article.
WikiFX Broker
Latest News
Rupee Recovers on RBI Support and Softer Oil
 WikiFX
Alfa Capital Review 2026: Should You Trade with This Broker?
WikiFXCatching Forex Breakouts After a Triangle Volatility Squeeze
WikiFXDollar Slumps On Iran Peace Hopes
WikiFXFBS Review: Regulation Warning Around a Broker Facing Withdrawal and Slippage Complaints
WikiFXRoboForex Review: Regulation Warnings Hit This Broker as Withdrawal Complaints Mount
WikiFXWhy Some Currency Pairs Have Much Wider Spreads Than Others
WikiFXHow Bank Rates, Reserves, and Revaluations Actually Move Currency Prices
WikiFXRupee Gains as Dollar Retreats
WikiFXSilverlight securities Review 2025: Is This Forex Broker Safe?
WikiFXCurrency Calculator
USD

CNY
Current Rate:0
Enter amount
USD
Redeemable Amount
CNY
Calculate 