
Global Broker Regulation Inquiry App
About WikiFX
English
简体中文
繁體中文
English
Pусский
日本語
ภาษาไทย
Tiếng Việt
Bahasa Indonesia
Español
हिन्दी
Filippiiniläinen
Français
Deutsch
Português
Türkçe
한국어
العربية
اردو
FPG USOUSD Market Report May 14, 2026
Abstract:USOUSD on the H1 timeframe chart shows that the price has successfully stabilized again above the 100 level, currently trading around 101.11. This bullish strengthening movement began from 90.55, form
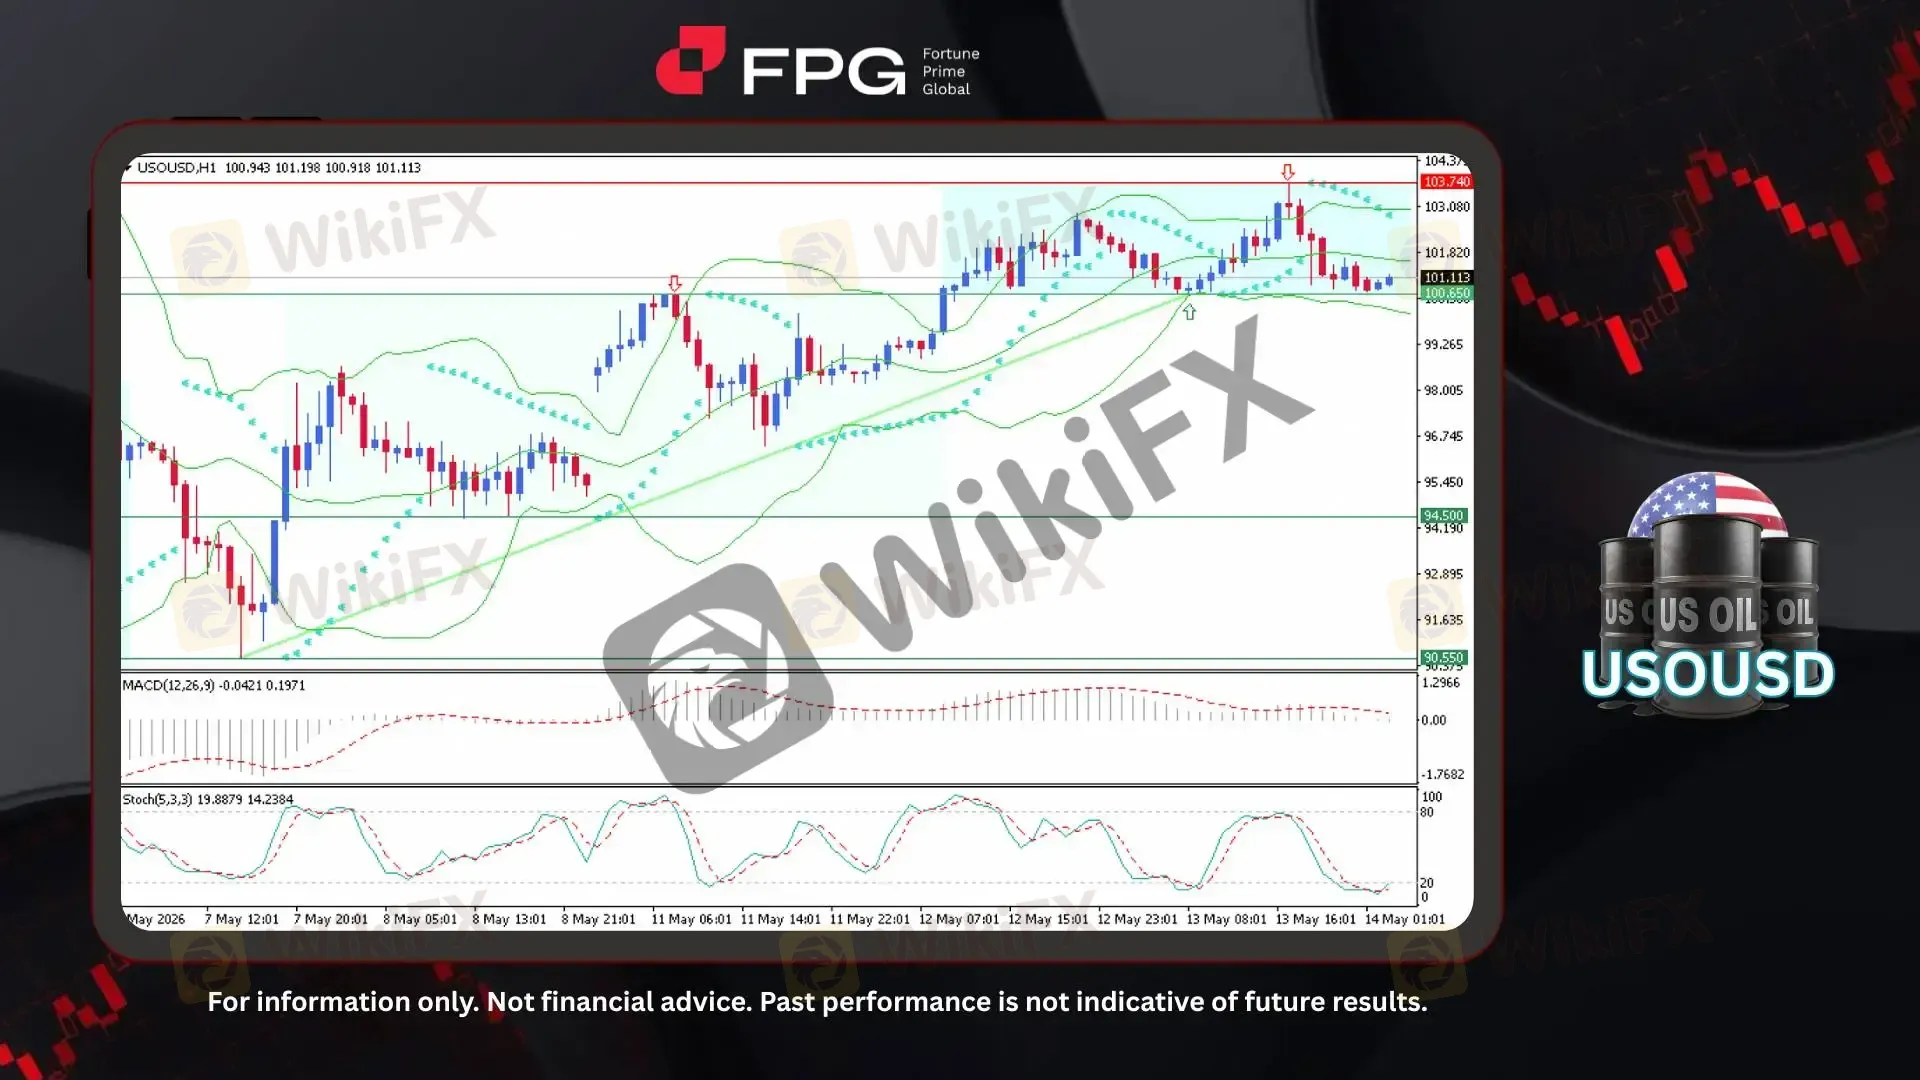
USOUSD on the H1 timeframe chart shows that the price has successfully stabilized again above the 100 level, currently trading around 101.11. This bullish strengthening movement began from 90.55, forming a support level at 94.50, before reaching a short-term peak at 103.74. The nearest support is located at 100.65, which previously acted as a resistance level but has now turned into support. The latest price movement is currently showing a relatively stable trend with no significant volatility observed in the near term.
From a technical indicator perspective, the Bollinger Bands show that the price is currently trading around the lower half of the band, reflecting ongoing short-term bearish correction pressure despite the broader bullish structure remaining intact. The Parabolic SAR dots have started appearing above several recent candles, indicating temporary downside momentum following the latest rally. Meanwhile, the MACD histogram is gradually weakening and moving closer to the neutral zone, suggesting that bullish momentum has slowed compared to the previous upward surge. On the Stochastic indicator, both lines are currently moving within the oversold area, signaling that the market may be approaching a potential short-term rebound if buying momentum begins to recover above the 100.65 support zone.
Global economic policy developments this week were driven by escalating Middle East tensions, tighter sanctions on major oil producers, ongoing US–China trade negotiations, and cautious policy signals from major central banks. Governments and financial institutions continued monitoring inflation risks and energy security concerns as uncertainty surrounding global growth and supply chains remained elevated. Market sentiment also reflected concerns over potential supply disruptions and stricter production controls from major energy exporters. Combined with rising geopolitical risks and tighter supply expectations, these factors have recently continued supporting the strengthening momentum in oil prices.
Technical Market Overview
1. Current Position: USOUSD on the H1 timeframe is currently trading around 101.11 after successfully stabilizing back above the psychological 100 level. The broader structure remains bullish following the strong upward movement from 90.55, although short-term consolidation and correction pressure are currently visible below the recent peak at 103.74.
2. Resistance Zone: The nearest resistance is located around 103.74, which represents the latest short-term high and recent bullish peak. A successful breakout above this level could reopen further upside continuation potential.
3. Support Zone: The nearest support is positioned around 100.65, which previously acted as a resistance area before turning into support. Stronger medium-term support remains visible around 94.50, which served as an important bullish base during the earlier recovery phase.
4. Indicator Observation: The Bollinger Bands show price trading around the lower half of the band, reflecting ongoing short-term bearish correction pressure. Parabolic SAR dots have shifted above recent candles, indicating temporary downside momentum. Meanwhile, the MACD histogram continues weakening toward the neutral area, signaling slowing bullish momentum. The Stochastic indicator is currently moving within the oversold zone, suggesting the possibility of a short-term rebound if buyers regain control.
5. Technical Summary: Overall, USOUSD still maintains a bullish medium-term structure despite the current consolidation phase. As long as price remains above the 100.65 support area, the broader upward trend remains valid. However, weakening momentum indicators suggest that the market may continue experiencing short-term sideways or corrective movement before attempting another bullish continuation toward the 103.74 resistance zone.
Market Performance:
Commodities Last Price % Change
UKOUSD 108.37 −0.05%
Today's Key Economic Calendar:
US: Fed Kashkari Speech
EU: ECB President Lagarde Speech
US: Fed Logan Speech
UK: RICS House Price Balance
CN: President Trump & President Xi Summit
UK: Business Investment QoQ Preliminary
UK: GDP 3-Month Average
UK: GDP Growth Rate QoQ & YoY Preliminary
UK: GDP MoM
UK: Goods Trade Balance & Non-EU
UK: Industrial & Manufacturing Production MoM
CN: New Yuan Loans
US: Export & Import Prices MoM
US: InitialJobless Claims
US: Retail Sales Control Group & Ex Autos MoM
US: Retail Sales MoM
US: Business Inventories MoM
Risk Disclaimer: This report is for informational purposes only and does not constitute financial advice. Investments involve risks, and past performance does not guarantee future results. Consult your financial advisor for personalized investment strategies.
Disclaimer:
The views in this article only represent the author's personal views, and do not constitute investment advice on this platform. This platform does not guarantee the accuracy, completeness and timeliness of the information in the article, and will not be liable for any loss caused by the use of or reliance on the information in the article.
WikiFX Broker
Latest News
TRANS X MARKETS Review 2026: Unregulated Status and Serious Withdrawal Complaints
 WikiFX
RyvoTrade Review 2026: Unregulated Status and Withdrawal Complaints
WikiFXPhillip Nova Review 2026: Should You Trade with This Broker?
WikiFXGFS Review 2026: Withdrawal Complaints, Weak Regulation Data, and Account Access Risks
WikiFXYen Firms While Dollar Pauses
WikiFXStoneX Review 2026: Should You Trade with This Broker?
WikiFXThinking About KATOPRIME? What Every Trader Should Know Before Depositing Funds
WikiFXYour Backtesting Results Mean Nothing If You Ignore This One Live Trading Reality
WikiFXHow Pig Butchering Scams Drain Beginner Trading Accounts
WikiFXWeltrade Review 2026: Is This Forex Broker Safe?
WikiFX