
Global Broker Regulatory Inquiry Platform
WikiFX
English
简体中文
繁體中文
English
Pусский
日本語
ภาษาไทย
Tiếng Việt
Bahasa Indonesia
Español
हिन्दी
Filippiiniläinen
Français
Deutsch
Português
Türkçe
한국어
العربية
FPG EURUSD Market Report March 23, 2026
Abstract:On the H1 timeframe chart, EURUSD previously experienced a bearish movement, followed by a bullish trend reversal from 1.1442 to 1.1615. After this upward move, price action stabilized and shifted int
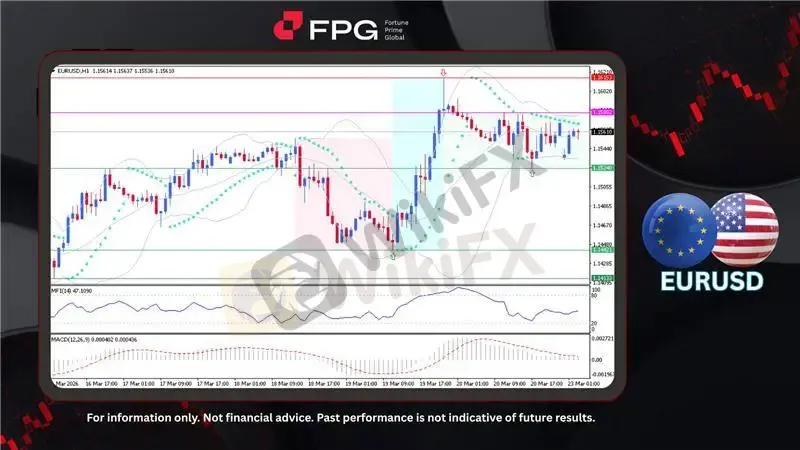
On the H1 timeframe chart, EURUSD previously experienced a bearish movement, followed by a bullish trend reversal from 1.1442 to 1.1615. After this upward move, price action stabilized and shifted into a sideways ranging structure between 1.1524 and 1.1580. The current price is trading around 1.1561, reflecting relatively low volatility and a consolidation phase following the recent bullish impulse.
From a technical perspective, Bollinger Bands are beginning to narrow, indicating reduced volatility and a consolidating market environment. Price is hovering near the middle band, suggesting neutral momentum without strong directional bias. The Parabolic SAR has shown frequent flips around price, reinforcing the ongoing indecision. Meanwhile, the MFI remains near the mid-level, pointing to balanced buying and selling pressure, while the MACD shows fading bullish momentum with a flattening signal.
Eurozone economic conditions remain fragile as inflation pressures persist, driven by elevated energy prices and ongoing geopolitical tensions, prompting the European Central Bank to maintain a cautious stance. Growth outlooks have been revised lower due to weak external demand and subdued industrial activity, although supported by resilient labor markets and gradual domestic recovery. At the same time, businesses face margin pressure from high input costs, contributing to mixed sector performance and relatively stable EURUSD movement.
Technical Market Overview
1. Current Position: EURUSD is trading around 1.1561, moving sideways after a strong bullish reversal from 1.1442 to 1.1615, indicating a consolidation phase within a short-term range.
2. Resistance Zone: The nearest resistance is located at 1.1580, aligning with the upper boundary of the current range, while a stronger resistance level is seen around 1.1615, marking the recent swing high.
3. Support Zone: Immediate support is found at 1.1524, which acts as the lower boundary of the consolidation range, followed by a stronger support level near 1.1442 as the key structural low.
4. Indicator Observation: Bollinger Bands are narrowing, signaling reduced volatility and consolidation. The Parabolic SAR shows mixed signals with frequent flips, while the MFI remains around mid-level, indicating balanced pressure. The MACD reflects weakening bullish momentum with a flattening signal line.
5. Technical Summary: EURUSD is currently in a consolidation phase following a bullish move, with no clear directional bias in the short term. Price is likely to continue ranging between key support and resistance levels unless a breakout occurs, supported by stronger momentum signals.
Market Performance:
Forex Last Price % Change
USD/JPY 159.17 −0.01%
GBP/USD 1.3333 −0.05%
Todays Key Economic Calendar:
US: Chicago Fed National Activity Index
EU: Consumer Confidence Flash
EU: ECB Lane Speech
Risk Disclaimer: This report is for informational purposes only and does not constitute financial advice. Investments involve risks, and past performance does not guarantee future results. Consult your financial advisor for personalized investment strategies.
Disclaimer:
The views in this article only represent the author's personal views, and do not constitute investment advice on this platform. This platform does not guarantee the accuracy, completeness and timeliness of the information in the article, and will not be liable for any loss caused by the use of or reliance on the information in the article.
WikiFX Broker
Latest News
STRIKE PRO Scam? Unregulated Broker & Recent Withdrawal Issues Exposed
 WikiFX
MONETA MARKETS User Reputation: Looking at Real User Reviews and Common Problems
WikiFXThe 2025 Golden Insight Award winners have been officially announced
WikiFXGODO Review: Trading Conditions, Account Types & User Reports
WikiFXExnova Review: Missing Funds, Blocked Accounts, and the Danger of Unregulated Brokers
WikiFXContractor Loses RM356,000 in “Marinasand” Investment Scam
WikiFXNewton Global: Is Your Money Safe? Unpacking Recent Withdrawal Issues
WikiFXOil back above $100 as conflicting reports emerge on US-Iran talks
WikiFXNVIDIA Faces Growth Limits: The Challenge of the Law of Large Numbers
WikiFXWhat Oil Price Surge Means for Global Economy in 2026
WikiFXCurrency Calculator
USD

CNY
Current Rate:0
Amount
USD
Available
CNY
Calculate 