
Global Broker Regulation Inquiry App
WikiFX
English
简体中文
繁體中文
English
Pусский
日本語
ภาษาไทย
Tiếng Việt
Bahasa Indonesia
Español
हिन्दी
Filippiiniläinen
Français
Deutsch
Português
Türkçe
한국어
العربية
FPG GBPUSD Market Report February 25, 2026
Abstract:On the GBPUSD chart with the H1 timeframe, price initially recorded two consecutive bearish drops, declining from 1.3581 to 1.3433. After reaching that low, the pair staged a rebound and reversed into
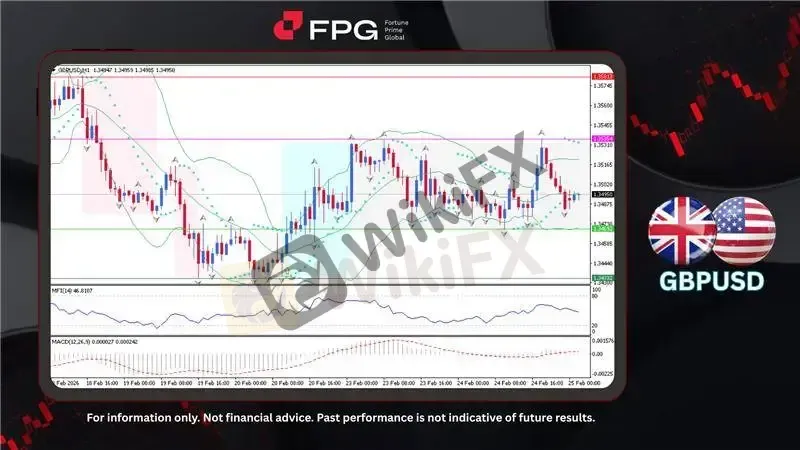
On the GBPUSD chart with the H1 timeframe, price initially recorded two consecutive bearish drops, declining from 1.3581 to 1.3433. After reaching that low, the pair staged a rebound and reversed into a bullish move toward 1.3535. Currently, price is trading around 1.3495 and continues to move within a sideways channel, indicating short-term consolidation.
Bollinger Bands show price fluctuating near the middle band, suggesting neutral momentum and range-bound conditions. The Parabolic SAR dots have recently shifted, reflecting a slight directional change. The MFI (14) is hovering around the mid-level (near 50), indicating balanced buying and selling pressure without overbought or oversold signals. Meanwhile, the MACD (12,26,9) histogram is relatively flat around the zero line, showing weakening bullish momentum and lack of strong trend continuation.
Over the past three days, GBPUSD has fluctuated around the 1.35 area after Bank of England Governor Andrew Bailey stated that a rate cut decision remains open, while UK services inflation remained relatively elevated. Meanwhile, minutes from the Federal Reserve reflected a cautious stance on policy easing, supporting the US dollar and putting pressure on the pound. Technically, GBPUSD briefly touched a one-month low before staging a limited rebound during the Asian session, with overall market sentiment remaining cautious.
Market Observation & Strategy Advice
1. Current Position: GBPUSD is trading around 1.3495, moving within a sideways consolidation range after rebounding from 1.3433. The short-term structure shows ranging behavior, with price fluctuating around the mid-Bollinger Band, indicating neutral momentum.
2. Resistance Zone: Immediate resistance is located at 1.3535 (recent swing high and upper range boundary). A confirmed breakout above this level may open the path toward 1.3581 as the next major resistance.
3. Support Zone: Nearest support stands at 1.3469, followed by stronger structural support at 1.3433 (previous swing low). A breakdown below 1.3433 could signal renewed bearish momentum.
4. Indicator Observation: MFI (14) is near the 50 level, reflecting balanced buying and selling pressure. MACD (12,26,9) is hovering around the zero line with a flattening histogram, suggesting weakening bullish momentum. Bollinger Bands are slightly narrowing, indicating volatility compression and potential breakout setup.
5. Trading Strategy Suggestions:
Range Strategy: Consider buy near support (1.3469) and sell near resistance (1.3535) while price remains inside the channel.
Bullish Breakout Scenario: A strong H1 close above 1.3535 may confirm upside continuation toward 1.3581.
Bearish Breakdown Scenario: A decisive break below 1.3469-1.3433 may expose further downside, potentially extending the prior bearish structure.
Market Performance:
Forex Last Price % Change
EUR/USD 1.1777 +0.04%
USD/JPY 155.90 +0.01%
Todays Key Economic Calendar:
US: Fed Barkin & Collins Speeches
US: API Crude Oil Stock Change
AU: Construction Work Done QoQ
AU: Inflation Rate MoM & YoY
AU: RBA Trimmed Mean CPI MoM & YoY
US: President Trump State of the Union Speech
DE: GfK Consumer Confidence
CN: FDI (YTD) YoY
US: MBA 30-Year Mortgage Rate
US: Fed Barkin Speech
US: EIA Crude Oil & Gasoline Stocks Change
Risk Disclaimer: This report is for informational purposes only and does not constitute financial advice. Investments involve risks, and past performance does not guarantee future results. Consult your financial advisor for personalized investment strategies.
Disclaimer:
The views in this article only represent the author's personal views, and do not constitute investment advice on this platform. This platform does not guarantee the accuracy, completeness and timeliness of the information in the article, and will not be liable for any loss caused by the use of or reliance on the information in the article.
WikiFX Broker
Latest News
Spotware Refines cTrader Infrastructure as Broker Ecosystem Expands
 WikiFX
CME Group Moves to 24/7 Trading for Digital Asset Derivatives
WikiFXIs The US Dollar About to Crash?
WikiFXIs AssetsFX Safe or Scam: Looking at Real User Feedback and Complaints
WikiFXTrump Defies Supreme Court with 15% Global Tariff; Record Retail Flows Buffer Market Impact
WikiFXRetail FX Insight: Volatility Squeeze and Regulatory Risks Persist as iFOREX Eyes IPO
WikiFX$128M Crypto Scam: Chinese Suspect Nabbed in Thailand
WikiFXIs Cabana Capital Safe or Scam: Looking at Real User Reviews and Common Problems
WikiFXThe Trading Pit Launches Regulated Brokerage Unit 'TTP Markets' in Strategic Pivot
WikiFXProp Trading Industry Pivots to Futures to Secure US Market Access
WikiFXCurrency Calculator
USD

CNY
Current Rate:0
Amount
USD
Available
CNY
Calculate 