
Global Broker Regulation Inquiry App
About WikiFX
English
简体中文
繁體中文
English
Pусский
日本語
ภาษาไทย
Tiếng Việt
Bahasa Indonesia
Español
हिन्दी
Filippiiniläinen
Français
Deutsch
Português
Türkçe
한국어
العربية
FPG USTEC Market Report February 12, 2026
Abstract:On the H1 timeframe, USTEC (Nasdaq-100) previously experienced a strong bearish move from 25,915 down to 24,143, forming a clear downward structure. After reaching that low, price rebounded sharply an
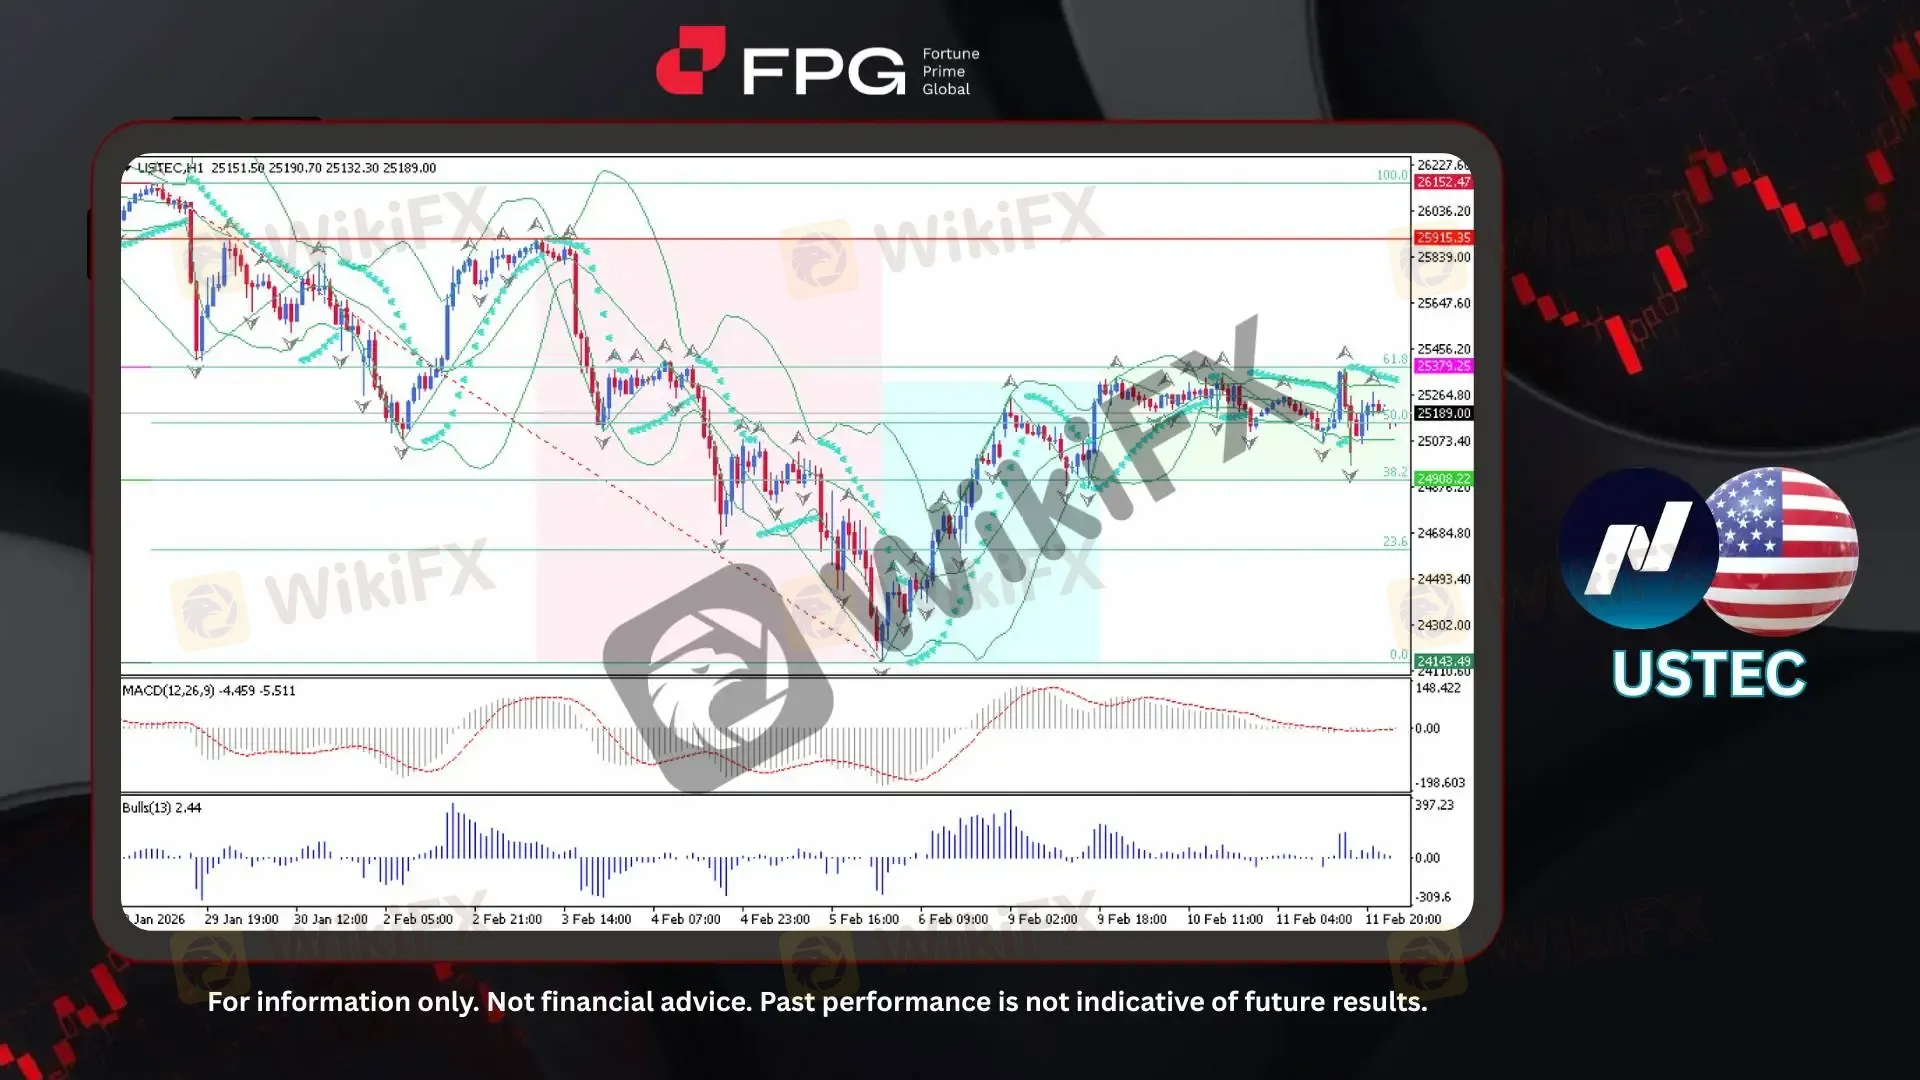
On the H1 timeframe, USTEC (Nasdaq-100) previously experienced a strong bearish move from 25,915 down to 24,143, forming a clear downward structure. After reaching that low, price rebounded sharply and shifted into a bullish recovery phase. Currently, USTEC is trading around 25,189 and moving sideways within a consolidation range. This sideways structure aligns with the Fibonacci 38.2%–61.8% retracement zone, with price hovering near the 50% retracement level, indicating a temporary equilibrium between buyers and sellers.
From a structural perspective, the bearish impulse has been followed by a corrective bullish phase, creating higher lows after the 24,143 bottom. However, the upward momentum has slowed as price approaches the mid-Fibonacci retracement zone. The market is now compressing beneath the 61.8% Fibonacci resistance around 25,379 and holding above the 38.2% support near 24,908, forming a short-term consolidation channel. This indicates hesitation as the market evaluates whether the recovery is sustainable or merely corrective. MACD (12,26,9) remains below the zero line at -4.459 / -5.511, suggesting that broader momentum still carries residual bearish pressure despite the recent rebound. Meanwhile, Bulls Power (13) prints positive at 2.44, showing that buying pressure is present but not dominant. Bollinger Bands are slightly contracting, reflecting declining volatility and reinforcing the consolidation narrative. Overall, indicators suggest a neutral-to-cautious stance rather than strong directional conviction.
USTEC remains highly sensitive to global macroeconomic developments, particularly Federal Reserve interest rate policy, inflation data, and overall investor risk sentiment toward technology stocks. In periods of economic uncertainty or hawkish monetary expectations, volatility in USTEC tends to increase due to the growth-dependent valuation structure of tech equities. As price consolidates near the 50% Fibonacci level, the next breakout, either above 61.8% or below 38.2%, will likely determine short-term directional bias.
Market Observation & Strategy Advice
1. Current Position: USTEC is trading around 25,189, consolidating near the 50% Fibonacci retracement level, reflecting temporary market balance.
2. Resistance: 25,379 (61.8% Fibonacci) acts as immediate resistance, limiting further upside recovery.
3. Support: 24,908 (38.2% Fibonacci) serves as key short-term support within the consolidation structure.
4. Indicator Observation: MACD remains below zero, indicating underlying bearish momentum has not fully reversed. Bulls Power (13) is positive at 2.44, suggesting moderate buying pressure but lacking strong bullish dominance.
5. Trading Strategy Suggestions:
Range strategy: Consider trading within the 24,908–25,379 range while consolidation persists.
Bullish scenario: A confirmed breakout above 25,379 may open room toward 25,915 resistance.
Bearish scenario: A breakdown below 24,908 could expose downside risk toward 24,143.
Market Performance:
Indices Last Price % Change
US500 6,945 +0.02%
US30 50,145 +0.07%
Todays Key Economic Calendar:
US: Monthly Budget Statement
US: Fed Logan Speech
UK: RICS House Price Balance
AU: RBA Hunter Speech
UK: Business Investment QoQ Prel
UK: GDP 3-Month Avg
UK: GDP Growth Rate QoQ & YoY Prel
UK: GDP MoM
UK: Goods Trade Balance (Total & Non-EU)
UK: Industrial & Manufacturing Production MoM
US: Initial Jobless Claims
US: Existing Home Sales
Risk Disclaimer: This report is for informational purposes only and does not constitute financial advice. Investments involve risks, and past performance does not guarantee future results. Consult your financial advisor for personalized investment strategies.
Disclaimer:
The views in this article only represent the author's personal views, and do not constitute investment advice on this platform. This platform does not guarantee the accuracy, completeness and timeliness of the information in the article, and will not be liable for any loss caused by the use of or reliance on the information in the article.
WikiFX Broker
Latest News
Q2 Broker Evaluation Campaign V2.0
 WikiFX
NZD Strength Without a Rate Hike: The Market Is Pricing a Policy the RBNZ Has Not Delivered
WikiFXCLEANO Review 2026: Is this Forex Broker Legit or a Scam?
WikiFXChina’s Renminbi Challenges Dollar Dominance | What It Means for Malaysia
WikiFXNew Traders Keep Losing — And It's Not Because of Their Strategy
WikiFXDubai Warning Issued After Fraudsters Impersonate a Legitimate DIFC Financial Firm
WikiFXItaly Blocks 32 More Unauthorized Financial Websites
WikiFXFXTM Moves to Deepen UAE Presence with Planned Licence Upgrade
WikiFXDeriv Review 2026: Is this Forex Broker Legit or a Scam?
WikiFXInflation gauge held sticky at 3% as U.S. headed into war with Iran, key Fed gauge shows
WikiFXCurrency Calculator
USD

CNY
Current Rate:0
Enter amount
USD
Redeemable Amount
CNY
Calculate 