
Global Broker Regulation Inquiry App
WikiFX
English
简体中文
繁體中文
English
Pусский
日本語
ภาษาไทย
Tiếng Việt
Bahasa Indonesia
Español
हिन्दी
Filippiiniläinen
Français
Deutsch
Português
Türkçe
한국어
العربية
Cooling Inflation Highlights a Healthy Macro Environment
Abstract:In yesterdays commentary, we reviewed the December FMS Fund Manager Survey, focusing on portfolio positioning and forward-looking views on AI. It is important to distinguish between long-only investor
In yesterdays commentary, we reviewed the December FMS Fund Manager Survey, focusing on portfolio positioning and forward-looking views on AI. It is important to distinguish between long-only investors and hedge funds, as their perspectives differ materially. Long-only institutions tend to position with a longer time horizon, and their continued bullish conviction has laid a solid confidence base for the current trends in equities and gold.
1. Liquidity Conditions: Ample Market Liquidity
SOFR, a key indicator for assessing U.S. dollar liquidity, is currently holding at 3.69%, below the upper bound of the Federal Reserves interest rate corridor (IORB). This suggests that liquidity conditions within the banking system remain healthy.
Benefiting from Fed rate cuts and ongoing short-term Treasury purchase programs (expected to continue through April next year), effective balance sheet expansion has already provided meaningful liquidity support to financial markets, regardless of whether the Feds rhetoric appears hawkish or dovish.
")
(Figure 1: SOFR | Source: New York Fed)2. Balance Sheet and Market Sentiment: Healthy and Rational
Based on the latest Federal Reserve balance sheet data, the Treasury General Account (TGA) remains above USD 850 billion, while bank reserves have stabilized around USD 2.9 trillion, signaling a broadly healthy macro-financial environment.
")
(Figure 2: Federal Reserve Balance Sheet | Source: Federal Reserve)
Recent pullbacks in technology stocks, triggered by weakness in Broadcom (AVGO) and Oracle, have led to a broader tech sector correction. While noise around AI-related themes persists, we view this move primarily as a valuation correction, rather than a deterioration in fundamentals.
The Fear & Greed Index has retreated into the “Fear” zone, reflecting a more cautious investor mindset. Importantly, there are no signs of irrational risk-chasing behavior in the market.
We believe that with conservative sentiment and a stable macro-financial backdrop, risk assets are more likely to continue a gradual upward trajectory, with limited probability of extreme short-term volatility.
")
(Figure 3: Fear & Greed Index | Source: CNN)U.S. CPI Review: Disinflation Supports Rate-Cut Expectations
Looking back at the November U.S. CPI data, headline CPI rose 2.7% YoY, while core CPI increased 2.6% YoY. Both readings came in below market expectations and continued to trend lower.
Although there were some data collection limitations in this CPI release, the results nonetheless reinforced market expectations for future rate cuts. Following the data release, major U.S. equity indices stabilized, and U.S. 10-year Treasury yields declined. Current market pricing now reflects expectations of approximately 200 basis points of cumulative rate cuts by 2026.
")
(Figure 4: U.S. November CPI Data | Source: BEA)
After digesting inflation-related volatility, market focus today has shifted to the Bank of Japans policy rate decision. Investors remain largely in wait-and-see mode, preferring to deploy capital once policy uncertainty clears.
Gold Technical Analysis
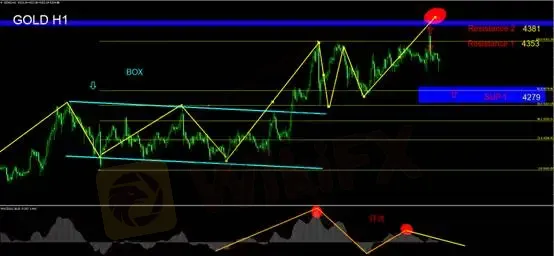
Gold recently posted a new swing high before reversing lower, failing to break above the 4,381 resistance level. On the hourly chart, price action formed a bearish engulfing pattern, signaling a near-term reversal.
Key downside support to watch intraday is 4,279, corresponding to the 38.2% Fibonacci retracement level. Overall, gold has returned to a range-bound consolidation structure.
From a momentum perspective, the MACD oscillator shows a bearish divergence: while prices briefly pushed above the prior high, the MACD failed to confirm. In addition, the MACD histogram has turned lower from above the zero line, suggesting that short-term trading strategies should lean toward the short side.
With the Bank of Japans rate decision introducing policy uncertainty, gold prices are likely to remain choppy within a range, with elevated risks of false breakdowns and false breakouts.
Support Levels
SUP1: 4,279
Resistance Levels
Resistance 1: 4,353
Resistance 2: 4,381
Risk Disclaimer
The above views, analyses, research, price levels, and related information are provided solely for general market commentary and do not represent the position of this platform. All readers assume full responsibility for their own trading decisions and associated risks. Please exercise caution when trading.
Disclaimer:
The views in this article only represent the author's personal views, and do not constitute investment advice on this platform. This platform does not guarantee the accuracy, completeness and timeliness of the information in the article, and will not be liable for any loss caused by the use of or reliance on the information in the article.
WikiFX Broker
Latest News
Should You Delete Every Indicator from Your Charts? Let’s Talk Real Trading
 WikiFX
Is ZarVista Legit? A Critical Review of Its Licenses and Red Flags
WikiFXStop Chasing Green Arrows: Why High Win Rate Strategies Are Bankrupting You
WikiFXStop Trading: Why "Busy" Traders Bleed Their Accounts Dry
WikiFXScam Victims Repatriated: Malaysia Thanks Thailand’s Crucial Help
WikiFXXTB Review 2025: Pros, Cons and Legit Broker?
WikiFXCabana Capital Review 2025: Safety, Features, and Reliability
WikiFXWhy You’re a Millionaire on Demo but Broke in Real Life
WikiFXYear of the Fire Horse 2026: Which Zodiac Signs Have the Strongest Money Luck in Trading?
WikiFXCommon Questions About OtetMarkets: Safety, Fees, and Risks (2025)
WikiFXCurrency Calculator
USD

CNY
Current Rate: 0
Amount
USD
Available
CNY
Calculate