
Global Broker Regulation Inquiry App
WikiFX
English
简体中文
繁體中文
English
Pусский
日本語
ภาษาไทย
Tiếng Việt
Bahasa Indonesia
Español
हिन्दी
Filippiiniläinen
Français
Deutsch
Português
Türkçe
한국어
العربية
FPG XAUUSD Market Report December 1, 2025
Abstract:XAUUSD (Gold) managed to break through the resistance level at 4125, and the price is now hovering around 4222. The price structure shows a consistent pattern of higher highs and higher lows, confirmi
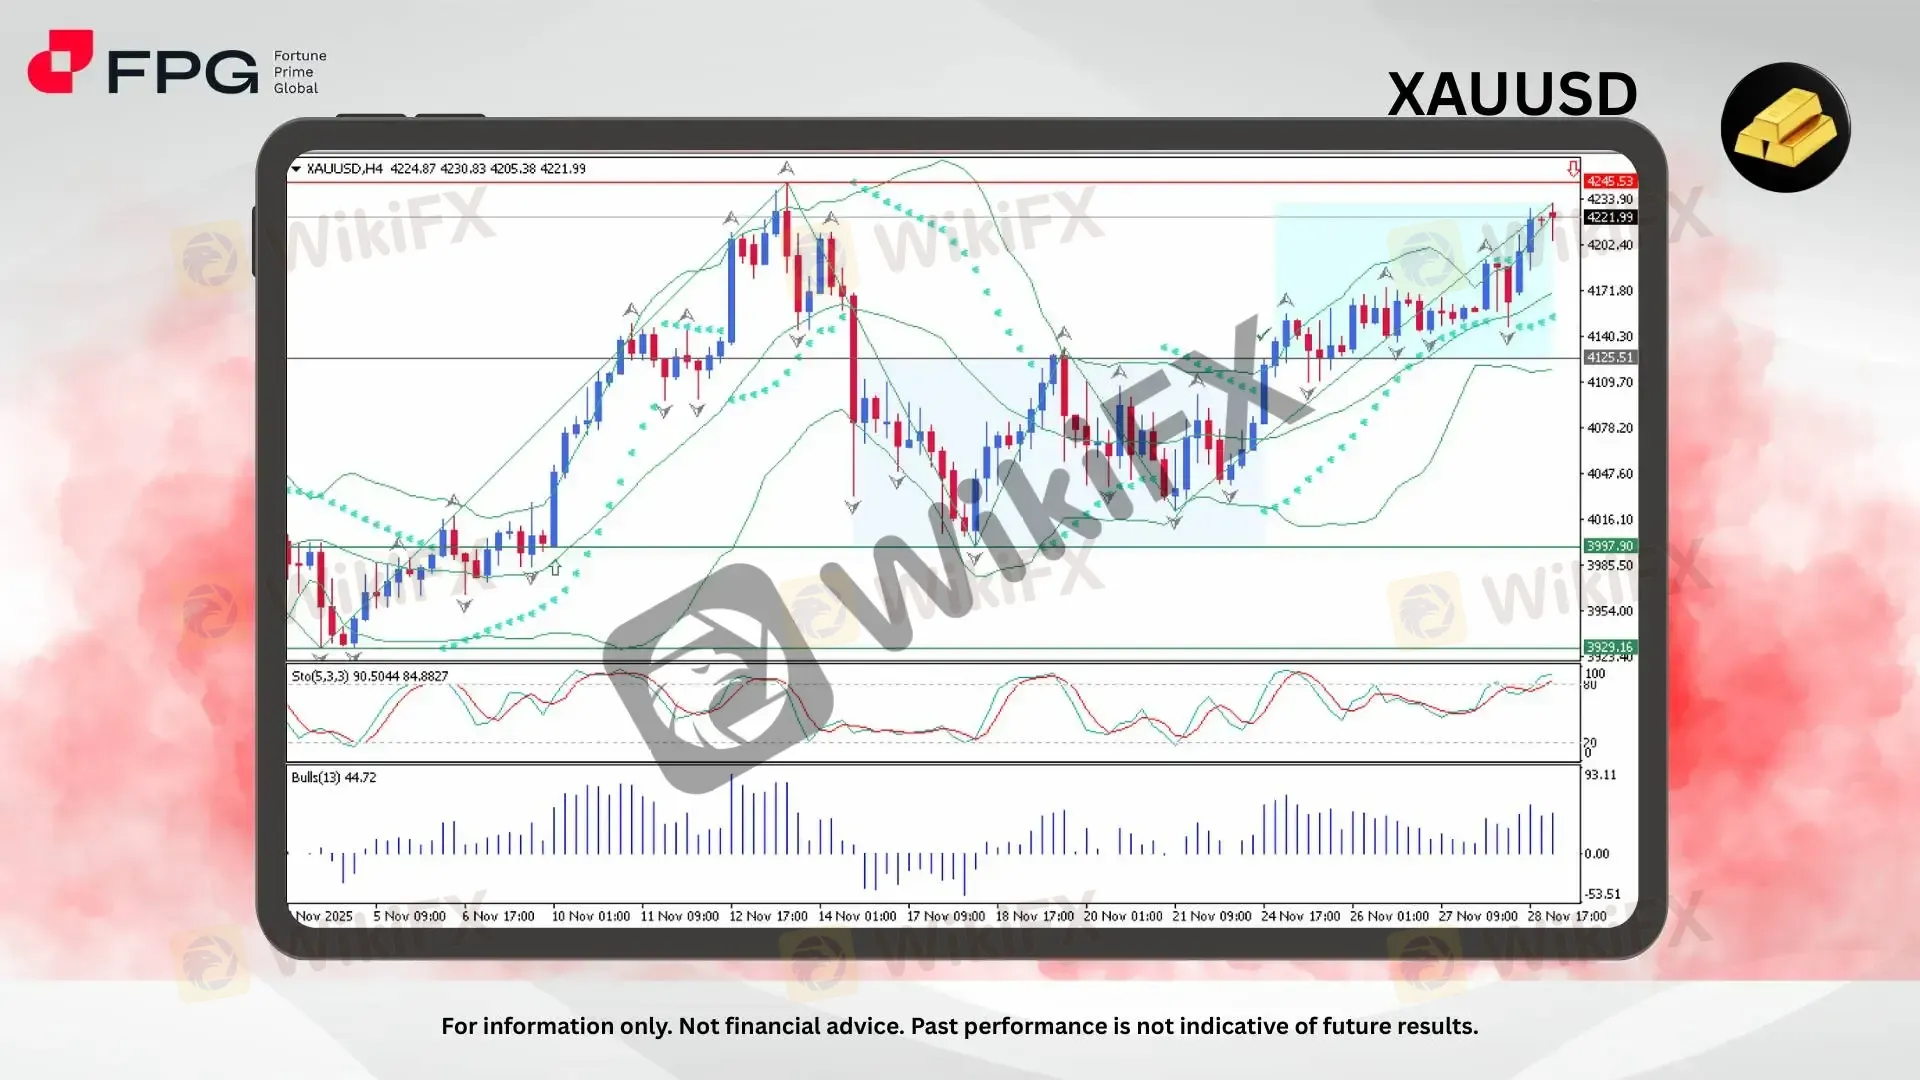
XAUUSD (Gold) managed to break through the resistance level at 4125, and the price is now hovering around 4222. The price structure shows a consistent pattern of higher highs and higher lows, confirming strong bullish sentiment. Current candles are testing the upper Bollinger Band, indicating momentum strength but also signaling potential overextension near resistance.
Price action remains firmly above both the middle Bollinger Band and Parabolic SAR dots, confirming sustained bullish momentum. The strong bullish candles indicate aggressive buying pressure, and the upper Bollinger Band expansion suggests the possibility of a trend continuation. However, current near-resistance behavior reveals signs of price hesitation, implying potential for pullback before any decisive breakout.
Stochastic Oscillator (5,3,3) is deep in overbought territory at 90.50 and 84.88, indicating bullish exhaustion and increased risk of corrective movement. Meanwhile, Bulls Power shows steady positive readings, reflecting strong buyer dominance, but with signs of flattening, signaling momentum fatigue. This combination suggests that while the bullish trend is intact, price may encounter resistance and short-term consolidation before any sustained breakout.
Market Observation & Strategy Advice
1. Current Position: XAUUSD is currently trading around 4222, building bullish pressure near a critical resistance after an extended upward rally, signaling a potential continuation or corrective pause.
2. Resistance Zone: Key resistance stands at 4245, marking a decisive supply zone. A breakout and sustained hold above this level could trigger further momentum toward 4300 and potentially 4350.
3. Support Zone: Immediate support is seen at 4125, aligning with the Bollinger lower-band and recent price structure. Deeper support rests at 3997, a significant demand zone that has historically held strong bullish reactions.
4. Indicators: Stochastic Oscillator is extremely overbought, signaling possible correction or pause in the rally. Bulls Power remains positive, indicating buyer dominance but showing early signs of momentum leveling off. Parabolic SAR supports the ongoing bullish trend.
5. Trading Strategy Suggestions:
Bullish Breakout Setup: Buy stop above 4250 with targets at 4300 and 4350, placing stop-loss below 4200.
Pullback Entry Setup: Buy limit around 4130–4150 targeting 4210 and 4240, with stop-loss below 4080.
Correction Scenario: If price rejects 4245 and breaks below 4125, consider short positions targeting 4030 and 3997, with stop-loss above 4170.
Market Performance:
Precious Metals Last Price % Change
XPTUSD 1,680.71 +0.57%
XAGUSD 56.9639 +1.01%
Today's Key Economic Calendar:
JP: Capital Spending YoY
AU: Company Gross Profits QoQ
JP: BoJ Gov Ueda Speech
CN: RD Manufacturing PMI
UK: BoE Consumer Credit
UK: Mortgage Approvals & Lending
CA: S&P Global Manufacturing PMI
US: ISM Manufacturing PMI
Risk Disclaimer: This report is for informational purposes only and does not constitute financial advice. Investments involve risks, and past performance does not guarantee future results. Consult your financial advisor for personalized investment strategies.
Disclaimer:
The views in this article only represent the author's personal views, and do not constitute investment advice on this platform. This platform does not guarantee the accuracy, completeness and timeliness of the information in the article, and will not be liable for any loss caused by the use of or reliance on the information in the article.
WikiFX Broker
Latest News
Absolute Markets 2025: Is It Scam or Safe? Suitable for Traders in Pakistan?
 WikiFX
Offshore Forex Brokers Ramp Up Expansion in Vietnam as Authorities Crack Down on Scams
WikiFX'Worse Than COVID': Weak US Manufacturing Surveys Signal Stagflation In November
WikiFXScam Alert: 8,500 People Duped with Fake 8% Monthly Return Promises from Forex and Stock Investments
WikiFXUK snack brand Graze to be sold to Jamie Laing\s Candy Kittens
WikiFXFTMO Completes Acquisition of Global CFDs Broker OANDA, Marking a Major Milestone
WikiFXHEADWAY: The Fast Track to Financial Dead-Ends?
WikiFXNovember private payrolls unexpectedly fell by 32,000, led by steep small business job cuts, ADP reports
WikiFXPlus500 Allegations Exposed in Real Trader Cases
WikiFXUS Industrial Production Sees Biggest Annual Gain In 3 Years Despite Slowing Capacity Utilization
WikiFXCurrency Calculator
USD

CNY
Current Rate: 0
Amount
USD
Available
CNY
Calculate