
Global Broker Regulation Inquiry App
WikiFX
English
简体中文
繁體中文
English
Pусский
日本語
ภาษาไทย
Tiếng Việt
Bahasa Indonesia
Español
हिन्दी
Filippiiniläinen
Français
Deutsch
Português
Türkçe
한국어
العربية
FPG USTEC Market Report November 26, 2025
Abstract:On the H1 chart, USTEC (Nasdaq) has regained bullish momentum after rebounding strongly from the lower support region around 23831 and breaking through previous consolidation zones. Price is currently
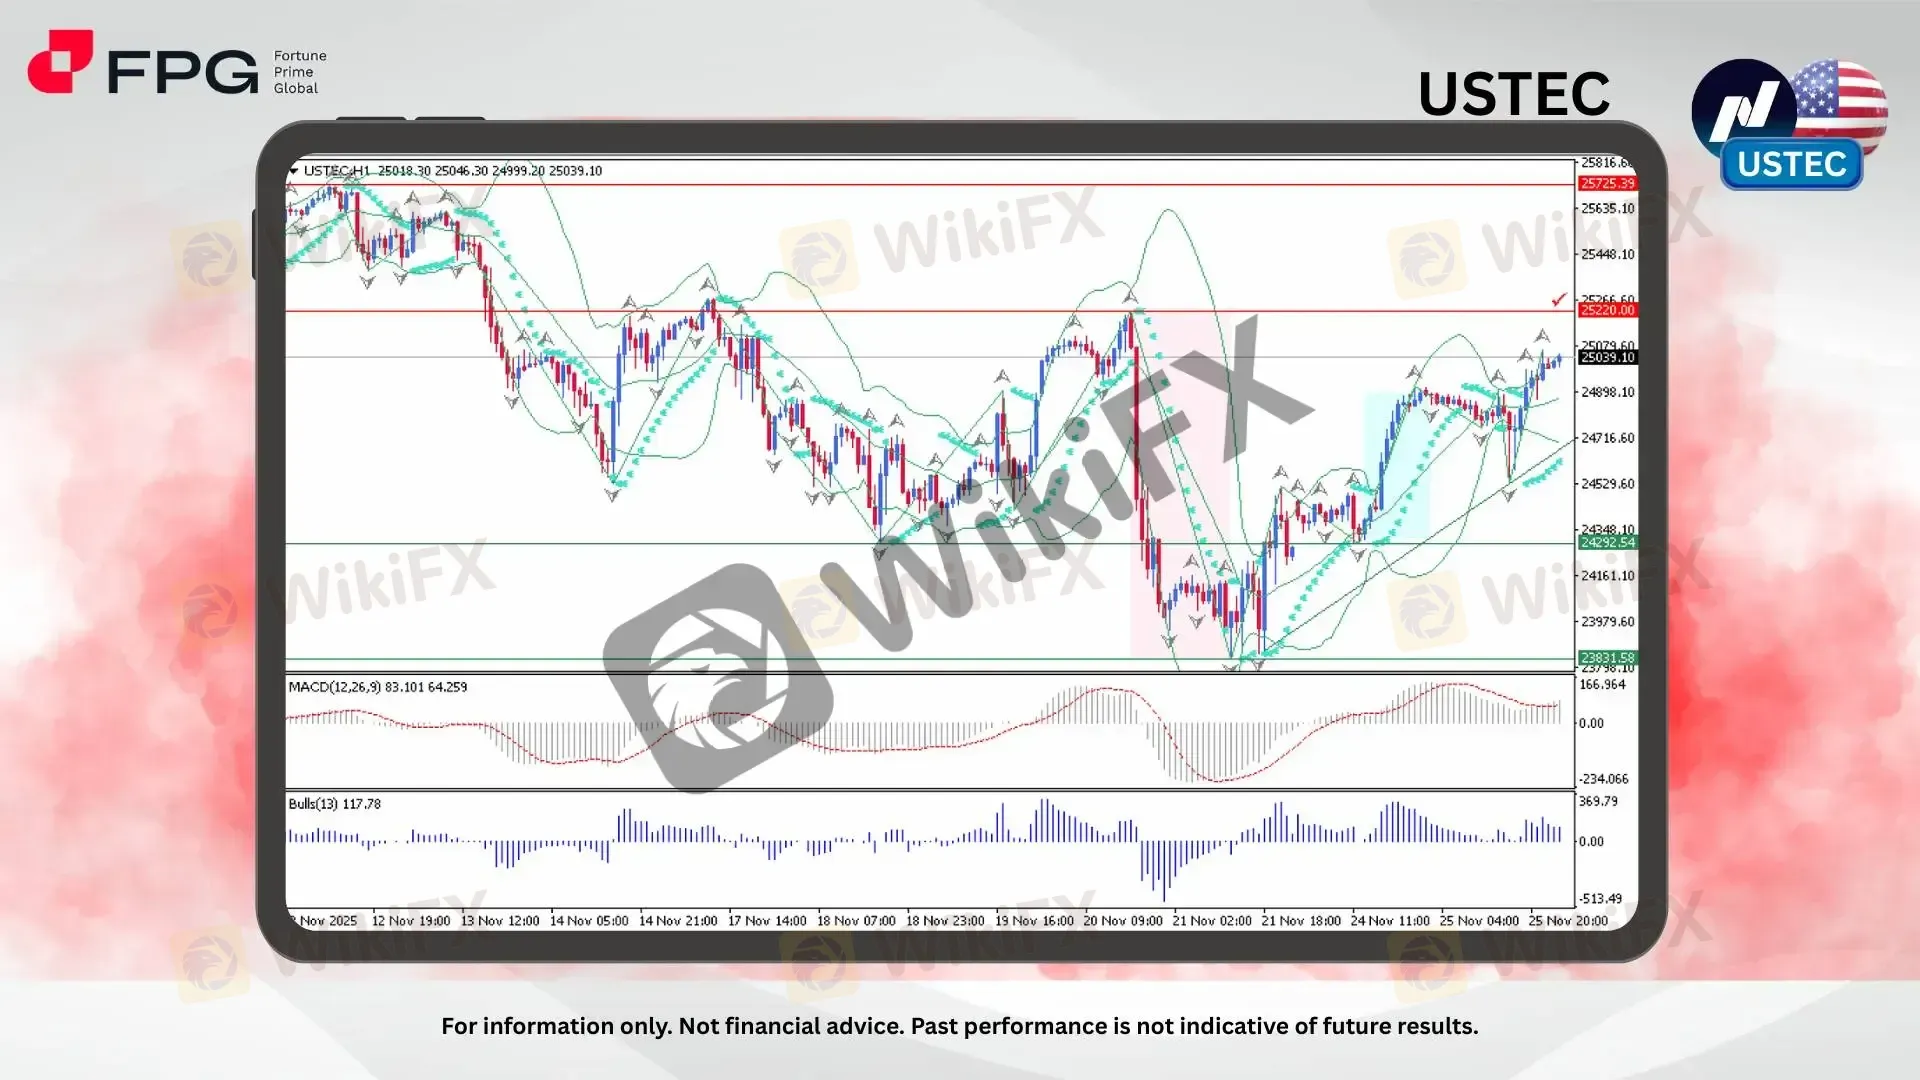
On the H1 chart, USTEC (Nasdaq) has regained bullish momentum after rebounding strongly from the lower support region around 23831 and breaking through previous consolidation zones. Price is currently trading around 25039, building a series of higher highs and higher lows while maintaining structure above the middle band. Volatility is expanding, and sentiment appears bullish as buyers drive price toward the upper region of the recent range, potentially eyeing a swing retest at 25220.
Bollinger Bands are widening, confirming increased volatility and directional bias favoring the bullish side. Price remains above the middle band, showing that buyers are in control. Candles in recent sessions have formed consistent bullish formations, while Parabolic SAR dots remain below price action, reinforcing upward traction. The price is approaching near-term resistance at 25220, which aligns with a previous rejection point and psychological barrier.
MACD lines are positioned in positive territory, and the histogram is expanding upward, reflecting strengthening bullish momentum. Bulls Power at 117.78 confirms strong buying activity, indicating that the current rally is supported by real momentum rather than a shallow technical pullback. Although price is nearing resistance, no significant overbought signal is present, suggesting room for continuation unless a rejection pattern emerges.
Market Observation & Strategy Advice
1. Current Position: USTEC (Nasdaq) trades around 25039, showing bullish sentiment and momentum recovery after a strong rebound from support levels.
2. Resistance Zone: Key resistance lies at 25220, with an extended target at 25725 if bullish momentum continues.
3. Support Zone: Initial support sits at 24292, followed by a stronger support region around 23831 if deeper correction occurs.
4. Indicators: Bollinger Bands are expanding, Parabolic SAR stays below price, MACD shows rising bullish histogram, and Bulls Power confirms strong buyer dominance. The recent price structure reflects a sustained bullish recovery with strengthening momentum, but approaching resistance could induce temporary congestion before any breakout attempt.
5. Trading Strategy Suggestions:
Bullish Continuation: Consider buy positions on a confirmed breakout above 25220, targeting 25725.
Retracement Buying: Look for long entries near 24292 on pullbacks, if price holds above middle band support.
Risk Management: Stop-loss placements can be considered below 23831 to protect against deeper trend reversal.
Market Performance:
Indices Last Price % Change
US500 6,771 +0.10%
US30 47,172 +0.07%
Today's Key Economic Calendar:
US: API Crude Oil Stock Change
AU: Construction Work Done QoQ
AU: Inflation Rate MoM & YoY
AU: RBA Trimmed Mean CPI MoM & YoY
AU: RBA Smith Speech
EU: ECB Financial Stability Review
US: MBA 30-Year Mortgage Rate
UK: Autumn Budget 2025
US: Durable Goods Orders MoM
US: Chicago PMI
US: EIA Crude Oil & Gasoline Stocks Change
Risk Disclaimer: This report is for informational purposes only and does not constitute financial advice. Investments involve risks, and past performance does not guarantee future results. Consult your financial advisor for personalized investment strategies.
Disclaimer:
The views in this article only represent the author's personal views, and do not constitute investment advice on this platform. This platform does not guarantee the accuracy, completeness and timeliness of the information in the article, and will not be liable for any loss caused by the use of or reliance on the information in the article.
WikiFX Broker
Latest News
Gratitude Beyond Borders: WikiFX Thank You This Thanksgiving
 WikiFX
MH Markets Commission Fees and Spreads Analysis: A Data-Driven Breakdown for Traders
WikiFXAlpha FX Allegations: Traders Claim Account Blocks, Withdrawal Denials and Security Breaches
WikiFXHow to Become a Profitable Forex Trader in Pakistan in 2025
WikiFXCFTC Polymarket Approval Signals U.S. Relaunch 2025
WikiFXZipphy Exposed: No Valid Regulation, Risk Warning
WikiFXKEY TO MARKETS Review: Are Traders Facing Withdrawal Delays, Deposit Issues & Trade Manipulation?
WikiFXFCA Consumer Warning – FCA Warning List 2025
WikiFXAustralia’s Fraud-Intel Network Exposes $60M in Scams
WikiFXMalaysia’s SkyLine Guide Top 25 Brokers Are Out!
WikiFXCurrency Calculator
USD

CNY
Current Rate: 0
Amount
USD
Available
CNY
Calculate