
Global Broker Regulation Inquiry App
WikiFX
English
简体中文
繁體中文
English
Pусский
日本語
ภาษาไทย
Tiếng Việt
Bahasa Indonesia
Español
हिन्दी
Filippiiniläinen
Français
Deutsch
Português
Türkçe
한국어
العربية
FPG XAUUSD Market Report November 25, 2025
Abstract:On the H4 chart, XAUUSD is maintaining a bullish stance after rebounding strongly from the support area around 3997, gradually approaching key resistance at 4150. Price trades around 4136, with consec
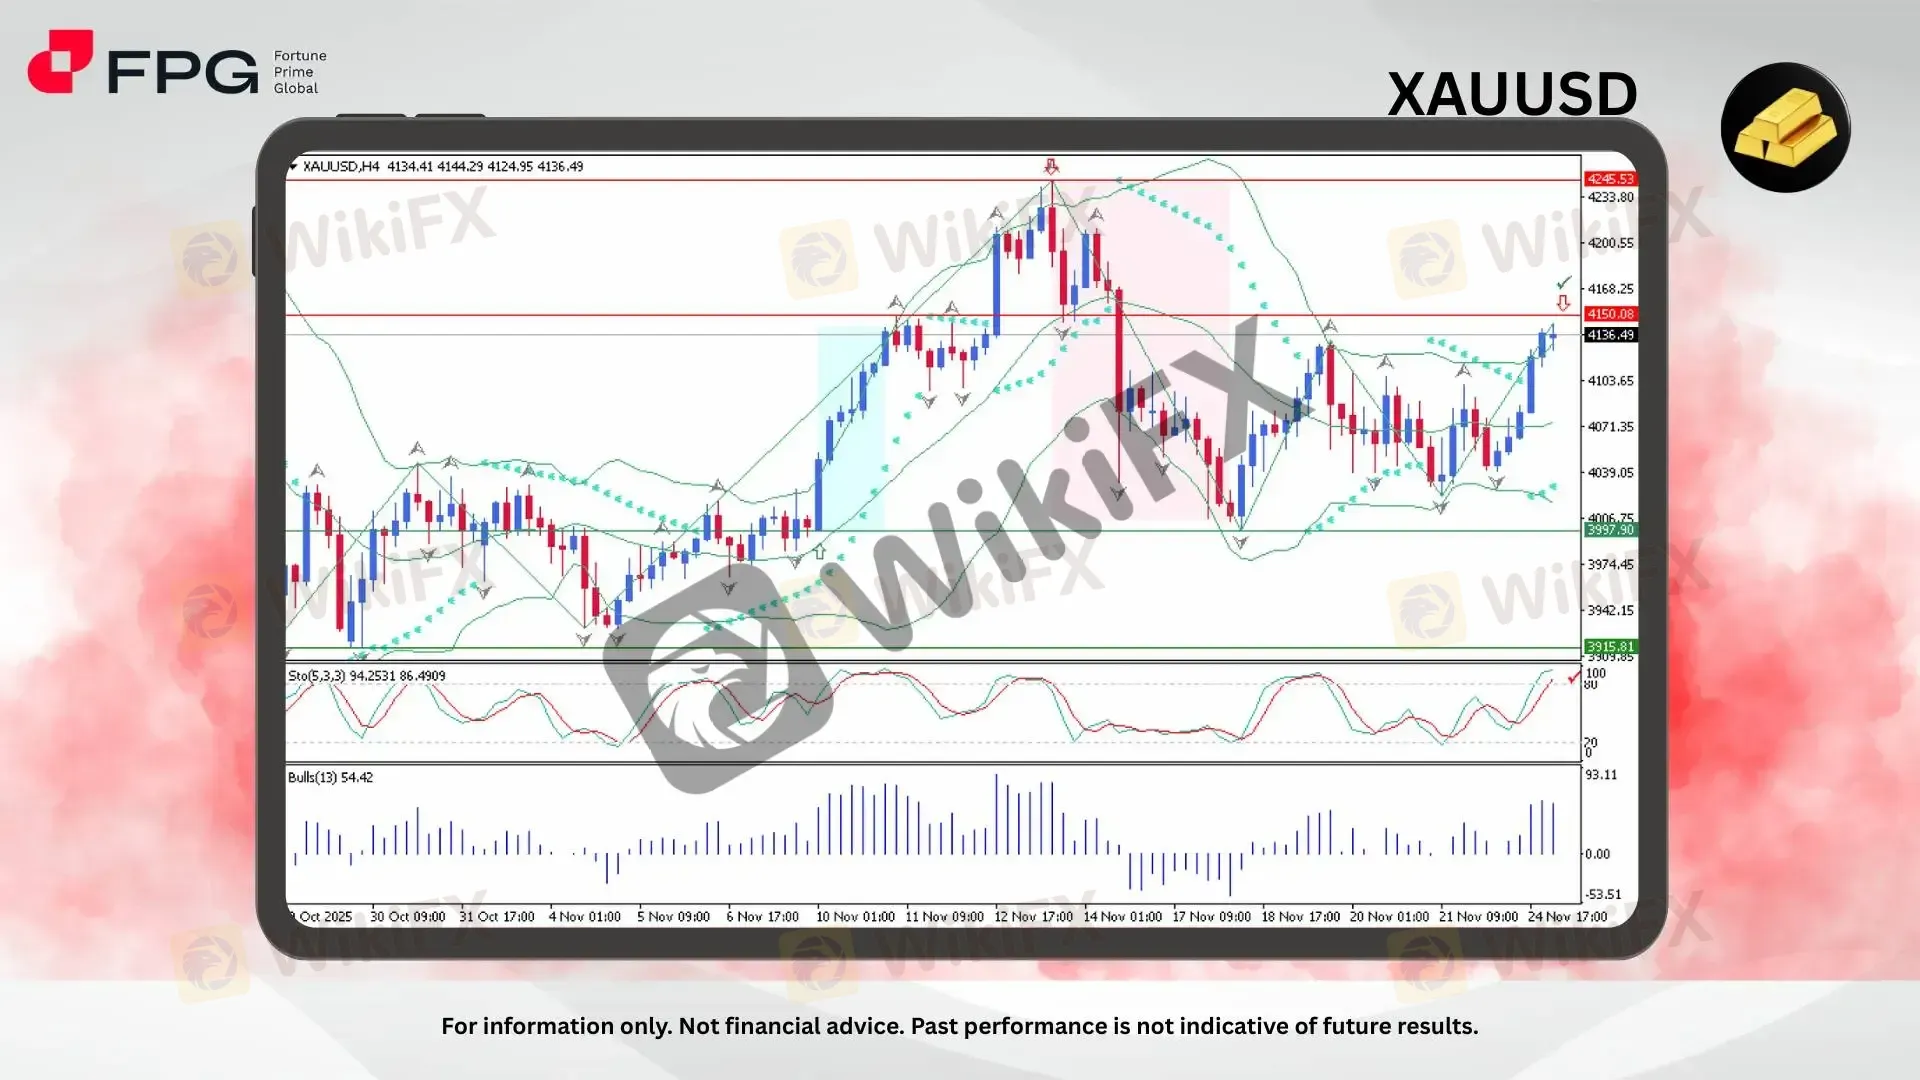
On the H4 chart, XAUUSD is maintaining a bullish stance after rebounding strongly from the support area around 3997, gradually approaching key resistance at 4150. Price trades around 4136, with consecutive higher lows signaling sustained buying interest. The Bollinger Bands are widening, and buyers appear increasingly active as price hovers near the upper band, indicating bullish pressure. This structure suggests a potential continuation move, although the proximity to resistance could prompt temporary consolidation or rejection.
Price action is currently navigating just below a significant horizontal resistance at 4150, where previous rejection occurred. The Bollinger Bands have begun expanding, indicating renewed volatility, while candles are consistently closing above the middle band, reflecting ongoing buyer dominance. Meanwhile, Parabolic SAR remains positioned below price action, further supporting the bullish outlook and showing strong directional bias.
The Stochastic Oscillator (5,3,3) is placed at 94.25/86.49, deeply in overbought territory, signaling a potential pullback or corrective pause. Bulls Power at 54.42 confirms strong buying interest, supporting broader bullish momentum, although the overextended oscillator suggests an impending short-term slowdown. With conflicting signals between momentum strength and overbought readings, the market is at a sensitive point where either a breakout or a correction may arise.
Market Observation & Strategy Advice
1. Current Position: XAUUSD trades around 4136, moving near the upper boundary of its short-term bullish structure, indicating strong buying pressure.
2. Resistance Zone: Immediate resistance stands at 4150, and if breached, may open the way toward 4210 and 4245.
3. Support Zone: Key support lies at 4071, with deeper protection at 3997, areas where price previously reacted with demand.
4. Indicators: Bollinger Bands are widening, and Parabolic SAR stays below price, signaling directional bullish momentum with increasing volatility. Overbought Stochastic suggests short-term exhaustion, but Bulls Power remains strong, indicating buyers are still in control of the broader trend.
5. Trading Strategy Suggestions:
Breakout Continuation: Buy if price breaks and closes above 4150, targeting 4210 and 4245.
Buy on Retracement: Consider long positions near 4071 or 3997 if corrective pullback occurs.
Risk Management: Place stop-loss below 3997 to protect against deeper downside shifts.
Market Performance:
Precious Metals Last Price % Change
XPTUSD 1,542.91 −0.19%
XAGUSD 51.1433 −0.39%
Today's Key Economic Calendar:
EU: New Car Registrations YoY
FR: Consumer Confidence
UK: CBI Distributive Trades
US: ADP Employment Change Weekly
US: PPI MoM
US: Retail Sales MoM
US: Business Inventories MoM
US: CB Consumer Confidence
US: Pending Home Sales MoM & YoY
Risk Disclaimer: This report is for informational purposes only and does not constitute financial advice. Investments involve risks, and past performance does not guarantee future results. Consult your financial advisor for personalized investment strategies.
Disclaimer:
The views in this article only represent the author's personal views, and do not constitute investment advice on this platform. This platform does not guarantee the accuracy, completeness and timeliness of the information in the article, and will not be liable for any loss caused by the use of or reliance on the information in the article.
WikiFX Broker
Latest News
Gratitude Beyond Borders: WikiFX Thank You This Thanksgiving
 WikiFX
MH Markets Commission Fees and Spreads Analysis: A Data-Driven Breakdown for Traders
WikiFXAlpha FX Allegations: Traders Claim Account Blocks, Withdrawal Denials and Security Breaches
WikiFXHow to Become a Profitable Forex Trader in Pakistan in 2025
WikiFXCFTC Polymarket Approval Signals U.S. Relaunch 2025
WikiFXZipphy Exposed: No Valid Regulation, Risk Warning
WikiFXKEY TO MARKETS Review: Are Traders Facing Withdrawal Delays, Deposit Issues & Trade Manipulation?
WikiFXFCA Consumer Warning – FCA Warning List 2025
WikiFXAustralia’s Fraud-Intel Network Exposes $60M in Scams
WikiFXMalaysia’s SkyLine Guide Top 25 Brokers Are Out!
WikiFXCurrency Calculator
USD

CNY
Current Rate: 0
Amount
USD
Available
CNY
Calculate