
Global Broker Regulation Inquiry App
WikiFX
English
简体中文
繁體中文
English
Pусский
日本語
ภาษาไทย
Tiếng Việt
Bahasa Indonesia
Español
हिन्दी
Filippiiniläinen
Français
Deutsch
Português
Türkçe
한국어
العربية
Equities Tumble, Crypto Markets Plunge
Abstract:Risk assets suffered a sharp one-day sell-off despite the absence of new negative catalysts in the market. Following the release of the U.S. September nonfarm payrolls report, risk sentiment briefly s
Risk assets suffered a sharp one-day sell-off despite the absence of new negative catalysts in the market. Following the release of the U.S. September nonfarm payrolls report, risk sentiment briefly surged. But as U.S. equities approached the closing bell, major indexes reversed gains and finished sharply lower, with the Philadelphia Semiconductor Index leading the declines. Meanwhile, the already-weak crypto market extended its losses, with Bitcoin breaking below $87,000—further eroding investors confidence in digital assets.
")
(Chart 1. Performance of U.S. and European Equity Markets; Source: MacroMicro)
The key question: Is the sell-off the start of a broader downtrend, or merely a healthy pullback within an ongoing bull market?
The recent bearish narrative has largely been fueled by Michael Burry—famous for “The Big Short”—who suggests Nvidia may be overstating its financial performance due to depreciation accounting. His comments reignited concerns around an “AI bubble.”
However, in our view, depreciation adjustments are not the primary factor driving market sentiment. With fundamentals for AI infrastructure still robust, we believe these concerns are overstated. The decline in risk assets appears more like a routine correction within a bull cycle—an opportunity for valuation reset rather than a structural reversal. Short-term volatility should be treated calmly.
Liquidity Conditions Remain Manageable
Toward year-end, liquidity typically tightens due to increased Treasury General Account (TGA) issuance during tax season. However, recent data suggests that U.S. dollar liquidity pressure is easing.
According to the Federal Reserves balance sheet, the TGA balance has fallen from $940B to $900B, while bank reserves have risen to $2.9T—leaving roughly $400B above the $2.5T threshold commonly viewed as “stress territory.” This implies low risk of a systemic liquidity event before the Fed halts QT.
")
(Chart 2. Federal Reserve Balance Sheet; Source: Federal Reserve)
Short-term funding pressures have also improved. The Secured Overnight Financing Rate (SOFR) declined from 4.00% to 3.94%, signaling reduced tightness in dollar borrowing. With no material liquidity concerns at the moment, recent market pullbacks do not appear threatening.
")
(Chart 3. SOFR Rate; Source: NY Federal Reserve)How Far Must Valuations Correct?
Using Yardeni Researchs S&P 500 EPS estimate of 310 for 2026, we apply valuation anchors based on historical multiples:
5-year forward P/E average: 20x
10-year forward P/E average: 18.7x
This implies fair-value levels around:
6200 (20×310)
5797 (18.7×310)
")
(Chart 4. S&P 500 2026 EPS Forecast; Source: Yardeni Research)
The recent equity decline appears driven more by profit-taking rather than fundamental deterioration. Therefore, the weakness in risk assets is unlikely to serve as a significant bullish catalyst for gold. With global liquidity still adequate, gold is more likely to trade sideways to lower, with a low probability of a meaningful rally.
Gold Technical Outlook
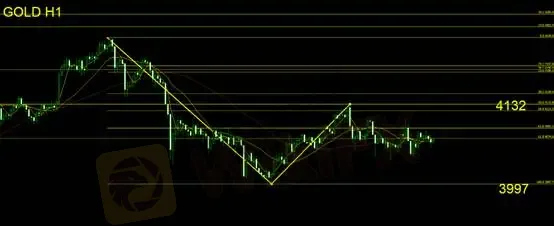
On the daily chart, gold continues to consolidate, forming a doji-like pattern with limited directional bias. Yesterday‘s expected bearish setup did not materialize, and today’s price action is likely to remain range-bound.
Resistance: 4132
Support: 3997
A break above 4132 is required to shift momentum upward. Below that level, sideways consolidation remains the high-probability scenario.
Risk Disclaimer
The above views, analysis, commentary, price levels, and related information are provided solely for general market commentary and do not represent the official stance of this platform. All readers should assess risks independently and exercise caution when trading.
Disclaimer:
The views in this article only represent the author's personal views, and do not constitute investment advice on this platform. This platform does not guarantee the accuracy, completeness and timeliness of the information in the article, and will not be liable for any loss caused by the use of or reliance on the information in the article.
WikiFX Broker
Latest News
Bessent believes there won't be a recession in 2026 but says some sectors are challenged
 WikiFX
Currency Calculator
USD

CNY
Current Rate: 0
Amount
USD
Available
CNY
Calculate