
Global Broker Regulation Inquiry App
WikiFX
English
简体中文
繁體中文
English
Pусский
日本語
ภาษาไทย
Tiếng Việt
Bahasa Indonesia
Español
हिन्दी
Filippiiniläinen
Français
Deutsch
Português
Türkçe
한국어
العربية
Rising Electricity Bills Erode Disposable Income: U.S. Faces Surge in Power Costs
Abstract:Power Prices Surge Amid AI-Driven DemandSeveral Democratic senators recently sent a letter to the White House, expressing concern that soaring electricity bills are burdening households. They pointed
Power Prices Surge Amid AI-Driven Demand
Several Democratic senators recently sent a letter to the White House, expressing concern that soaring electricity bills are burdening households. They pointed out that the massive energy demand from AI infrastructure may be driving up utility costs and urged the administration to explain the underlying factors behind rising power prices.
Electricity, much like gasoline, is a low-elasticity (essential) expense. When prices surge, these necessary costs erode consumers disposable income. According to the Bureau of Economic Analysis (BEA) Consumer Price Index report, U.S. electricity costs rose 6.2% year-over-year in August and 5.1% in September, nearly twice the pace of overall inflation.
")
(Figure 1. CPI Components – Electricity; Source: BEA)Trumps Price-Cut Strategy to Ease Consumer Burdens
As living costs continue to climb, former President Donald Trump has opted to lower prices instead of issuing direct subsidies. On November 13, he lifted tariffs on certain food imports from Argentina, Ecuador, Guatemala, and El Salvador, aiming to reduce prices for commodities such as coffee and bananas—effectively easing the burden on consumers through cheaper essentials.
Electricity Costs and Political Impact
The surge in electricity prices could play a pivotal role in U.S. elections, including the midterms. Voters concern about affordability remains one of the key drivers of electoral behavior, as electricity accounts for a major share of household expenditures.
Moreover, sustained price pressure may shape expectations for future monetary policy, potentially prompting a more accommodative stance or expanded fiscal stimulus.
Fiscal Outlook and Tariff Revenue
Treasury Secretary Janet Bessent stated that tariffs generate dividends while also helping to reduce U.S. debt. As of August 31, net tariff revenue totaled $195 billion, and projections suggest it could reach $300 billion by fiscal year 2025.
This additional revenue may help ease financial pressures, with inflation expected to curve downward and real income growth to accelerate in the first half of 2025.
However, markets remain cautious toward this fiscal boost, mainly due to legislative hurdles that make implementation uncertain.
Consumer Spending Outlook
Due to a lack of updated economic data, analysts cannot fully assess recent trends in disposable income or retail sales. Nonetheless, assuming steady wage growth, the rise in low-elasticity expenses such as utilities will likely alter consumption patterns among households.
Notably, the top 20% of Americans account for the majority of total consumption, with most being equity holders.
According to the University of Michigan Consumer Sentiment Index, overall consumer confidence in November dropped 6%, yet confidence among stockholders rose 11%, supported by the wealth effect of record-high equity markets.
This trend could sustain the “Santa Claus rally” into Q4, fueling cyclical market strength during the holiday season.
Potential Challenges Ahead
The real challenge may emerge in Q1 and Q2 of next year. Should equity markets falter, the resulting wealth contraction among major consumers could significantly dampen final demand, raising the risk of a slowdown in consumption momentum and potential deflationary pressure.
Gold Technical Analysis
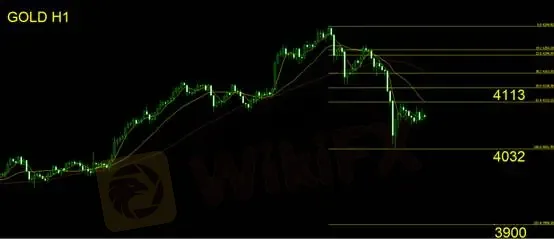
On the daily chart, gold has recorded two consecutive bearish sessions, showing no clear signs of reversal. Intraday momentum favors continued downside movement, with focus on key resistance levels at 4113 and 4138.
If the price fails to break above these levels and forms a bearish reversal candlestick pattern on the hourly chart, short positions are recommended.
Stop-Loss: $30
Support: 4032 / 3900
Resistance: 4113
Risk Disclaimer: The above opinions, analyses, research, prices, and other information are provided for general market commentary only and do not represent the platforms stance. All viewers are responsible for their own trading decisions. Please proceed with caution.
Disclaimer:
The views in this article only represent the author's personal views, and do not constitute investment advice on this platform. This platform does not guarantee the accuracy, completeness and timeliness of the information in the article, and will not be liable for any loss caused by the use of or reliance on the information in the article.
WikiFX Broker
Latest News
Simulated Trading Competition Experience Sharing
 WikiFX
WinproFx Regulation: A Complete Guide to Its Licensing and Safety for Traders
WikiFXInteractive Brokers Expands Access to Taipei Exchange
WikiFXAxi Review: A Data-Driven Analysis for Experienced Traders
WikiFXINZO Regulation and Risk Assessment: A Data-Driven Analysis for Traders
WikiFXCleveland Fed's Hammack supports keeping rates around current 'barely restrictive' level
WikiFXDelayed September report shows U.S. added 119,000 jobs, more than expected; unemployment rate at 4.4%
WikiFXThe CMIA Capital Partners Scam That Cost a Remisier Almost Half a Million
WikiFXeToro Cash ISA Launch Shakes UK Savings Market
WikiFXIs Seaprimecapitals Regulated? A Complete Look at Its Safety and How It Works
WikiFXCurrency Calculator
USD

CNY
Current Rate: 0
Amount
USD
Available
CNY
Calculate