Abstract:Learn about the 5 most powerful forex trading indicators every trader should use. Improve your market analysis, trading decisions, and accuracy with these essential tools.

Forex trading is an adventure that can be both rewarding and demanding. With trillions of dollars exchanged daily, the market attracts traders eager to seize profit opportunities—but without solid tools, charting a successful course is far from easy. Among the essential assets in a trader's toolkit, forex indicators stand out as vital for making smart and timely choices.
Equipped with the right indicators, you can spot market trends, determine optimal entry and exit points, and manage the risks that come with every trade. Below, you'll find an in-depth look at five influential forex trading indicators, along with practical ways to apply them and improve your results.
 Contents
Top Indicators for Tracking Trends and Volatility
Understanding the markets rhythm—its trends and bouts of volatility—is key to smart trading. By tracking these, you gain clarity on likely price swings and minimize nasty surprises. Here are some of the most reliable indicators used to monitor trends and assess volatility:
1. Moving Averages (MA)
Moving averages help smooth out chaotic price action, offering a clearer perspective on where the market is heading. The two workhorse variants are:
- Simple Moving Average (SMA): Calculates the average of closing prices over a number of periods.
- Exponential Moving Average (EMA): Puts more emphasis on recent price data for quicker reaction to market moves.
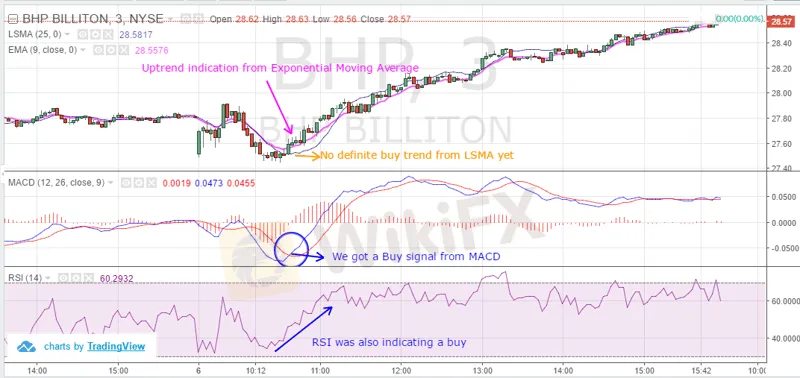
Application: If a currency pairs price jumps above its moving average, traders may take that as a buy signal; a drop below can hint at a possible sell. Moving averages not only flag possible entry and exit points, but also confirm whether a market is trending upward or downward.
2. Bollinger Bands
Bollinger Bands measure volatility using three lines: a central SMA flanked by bands set at a distance determined by price volatility. When market activity soars, the bands widen; during calm phases, they contract.
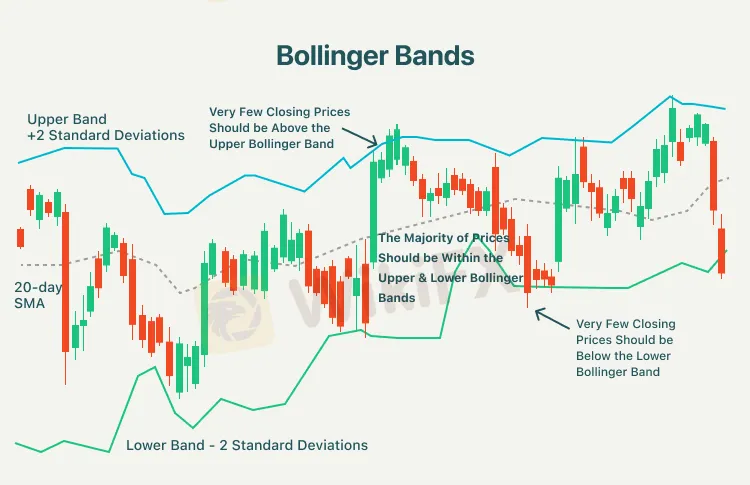
Application: Touching or surpassing the upper band can hint that the market is overbought, while slipping to the lower band may signal oversold conditions. A squeeze—when bands are tight—often comes right before a breakout move, making it an alert for potential opportunities.
Essential Indicators for Maximizing Trading Accuracy
Picking the right moments to act is everything in forex. These tools are favorites for those looking to raise their trading accuracy.
3. Relative Strength Index (RSI)
RSI is a momentum oscillator mapping the speed and size of price shifts on a 0–100 scale. Levels above 70 often mean a markets overbought, while scores below 30 suggest it could be oversold.
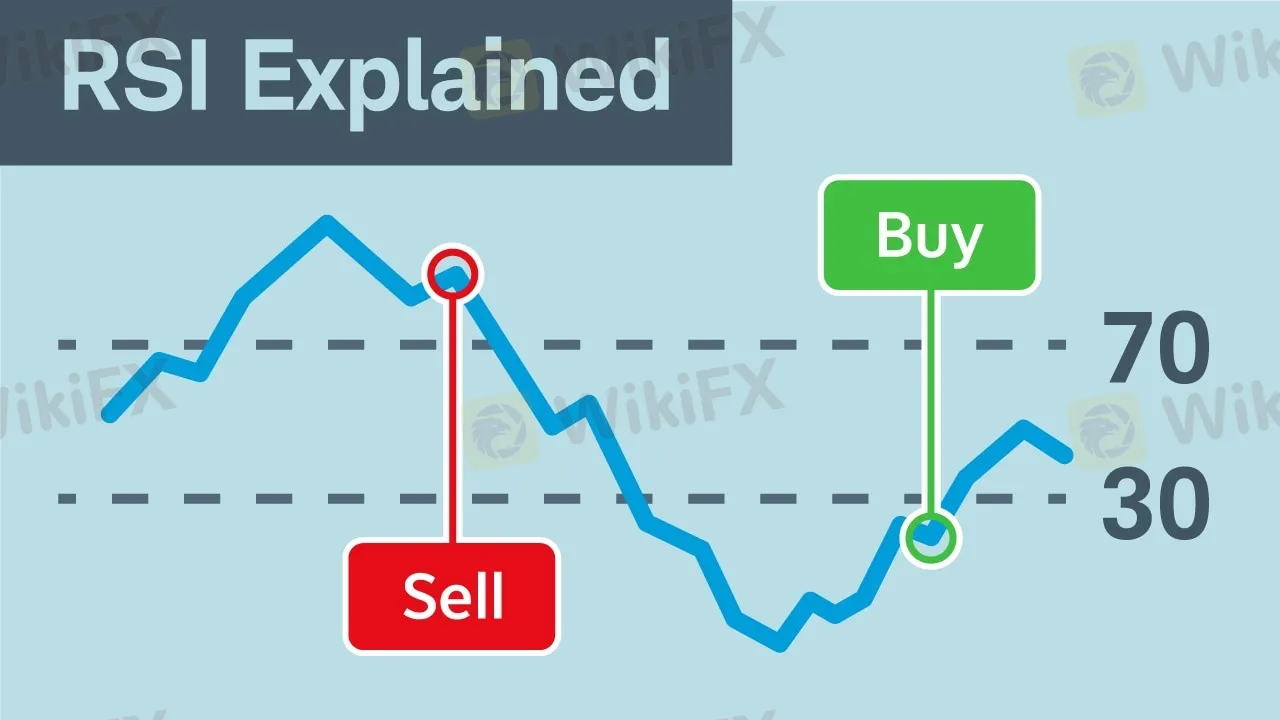
Application: RSI shines at warning about potential trend reversals. If it climbs above 70, a pullback might be on the way. Dip below 30? That could open the door to a rebound. Pairing RSI with other indicators helps confirm signals and reduce false alarms.
4. Moving Average Convergence Divergence (MACD)
MACD tracks the gap between two exponential moving averages, usually set at 12 and 26 periods. Its a favorite for spotting shifts in trend momentum and direction.
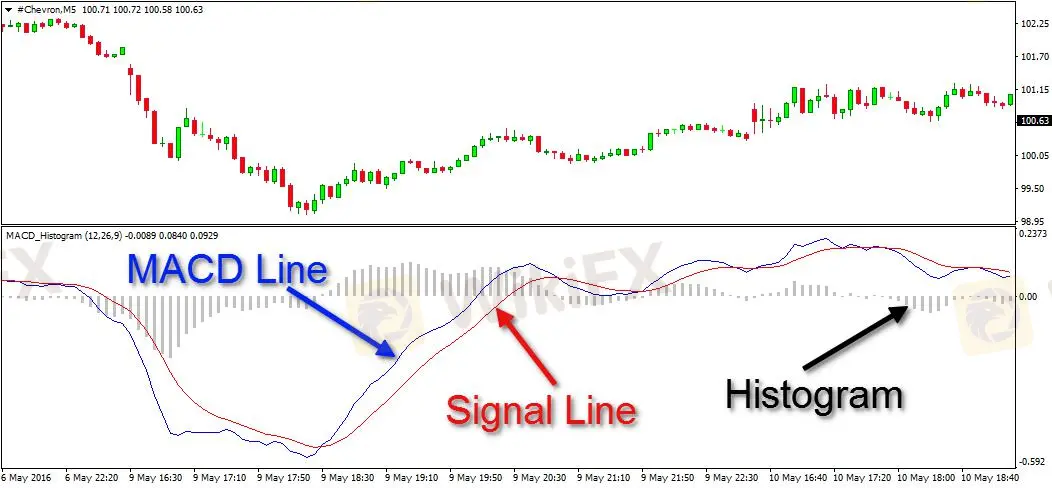
Application: The indicator features the MACD line and its signal line. A cross above the signal hints at buying momentum; a drop below is a selling clue. Additionally, divergences between MACD and price action often flag trend changes ahead.
5. Stochastic Oscillator
The Stochastic Oscillator evaluates where a closing price sits relative to the recent trading range, shown on a scale from 0–100.
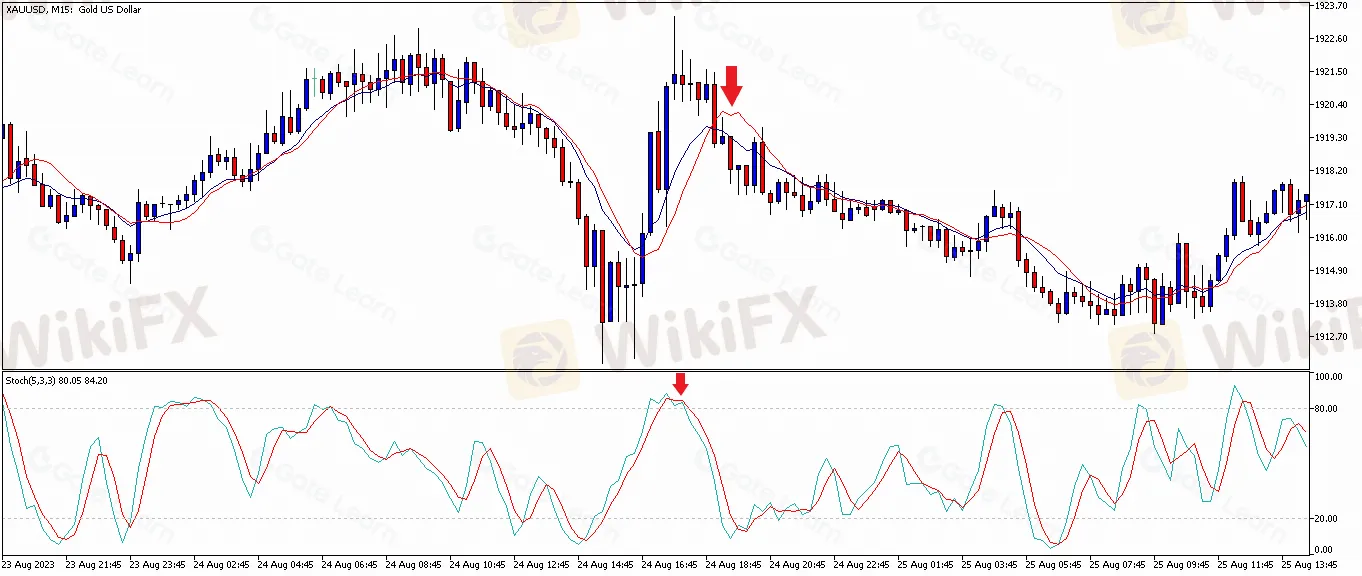
Application: Values above 80 often indicate an overbought condition, while scores below 20 suggest overselling. Traders rely on crossovers within these zones to anticipate reversals—especially when confirmed by other indicators.
How to Use Technical Indicators for Better Decisions
Mastering these indicators isn‘t just about understanding each one in isolation; it’s how you weave them together that truly sharpens your trading edge.
- To Confirm Trends: Pair moving averages with the MACD. For example, if the price is above its MA and the MACD signals upward momentum, thats a strong trend confirmation.
- To Assess Volatility: Watch both Bollinger Bands and RSI. If prices hug the upper band while the RSI exceeds 70, its a warning sign of a potential reversal.
- To Catch Reversals: Use RSI together with MACD. If RSI notifies you of an overbought or oversold market just as MACD signals a cross, the odds of a turnaround rise.
Going Beyond Indicators
While technical indicators are invaluable, they arent magic. A sharp trader also considers:
- Risk Management: Always use stop-loss and take-profit points. Even a strong indicator signal isnt foolproof; safeguarding your capital is paramount.
- Market Context: No indicator replaces a broader understanding of the market. News events, economic data, and politics can all override signals in a flash. Staying informed ensures your decisions arent made in a vacuum.
Final Thoughts
Harnessing the right mix of indicators—moving averages, Bollinger Bands, RSI, MACD, and the Stochastic Oscillator—can elevate your trading game. When used thoughtfully and combined with solid risk management, these tools tip the odds in your favor when making trading decisions.
Never forget: indicators are guides, not guarantees. The most successful traders are perpetual learners, always testing, refining, and adapting their strategies. Explore these tools, develop your personal approach, and youll carve out your own path to forex trading success.