简体中文
繁體中文
English
Pусский
日本語
ภาษาไทย
Tiếng Việt
Bahasa Indonesia
Español
हिन्दी
Filippiiniläinen
Français
Deutsch
Português
Türkçe
한국어
العربية
Price Action: The Power of the Wick
Abstract:Probably one of the more compelling areas of price action is in its ability to show key levels or price zones that matter. And to be sure, there’s a lot of ways of finding potential support and resistance levels but none of those prices are worth very much if they don’t actually show as support or resistance.

For the purpose of identifying support and resistance, candlestick wicks can be incredibly powerful and this also speaks to multiple time frame analysis.
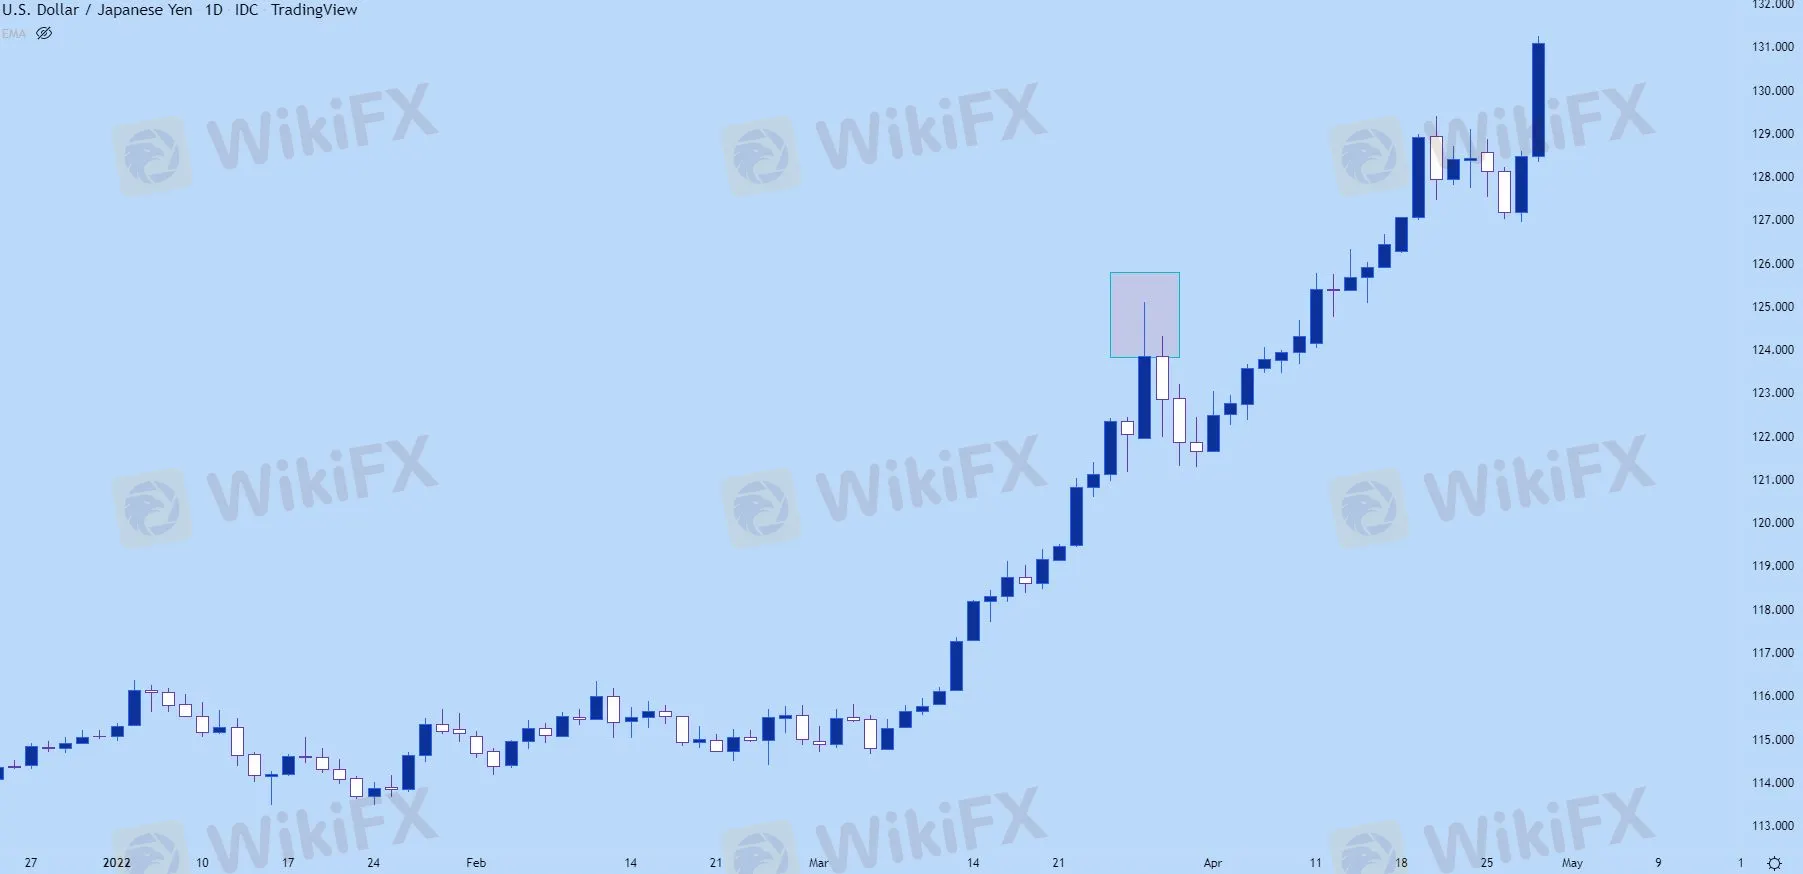
If youre following prices on an hourly chart and price suddenly reverses from a bullish trend, erasing the entirety of the move – how would that show on a daily chart?
Likely, this will illustrate as a wick sitting atop that daily bar indicating the reversal that had taken place. On the below daily chart of USD/JPY, Ive identified such an extended wick, and notice that the three days that followed continued to see prices pull back despite a very strong trend that led into the move.
USD/JPY Daily Price Chart
On the below hourly chart, were taking a closer look at that same iteration and we can see that there was an extended upper wick there, as well, albeit much smaller than the wick that showed on the daily.
That three day sell-off started from a fairly clear reversal that had even showed on the hourly chart.
What‘s going on here: Likely there was a catalyst of some type that started a fast reversal and this is simply the playing out of that new ’bearish‘ factor getting priced-in. And, as we looked price action trends, trends do not move in a linear manner, its often a sequencing of ’two steps forward, one step back,‘ and that’s showing in the below example after the reversal began as ‘two steps down, one step up.’
USD/JPY Hourly Price Chart
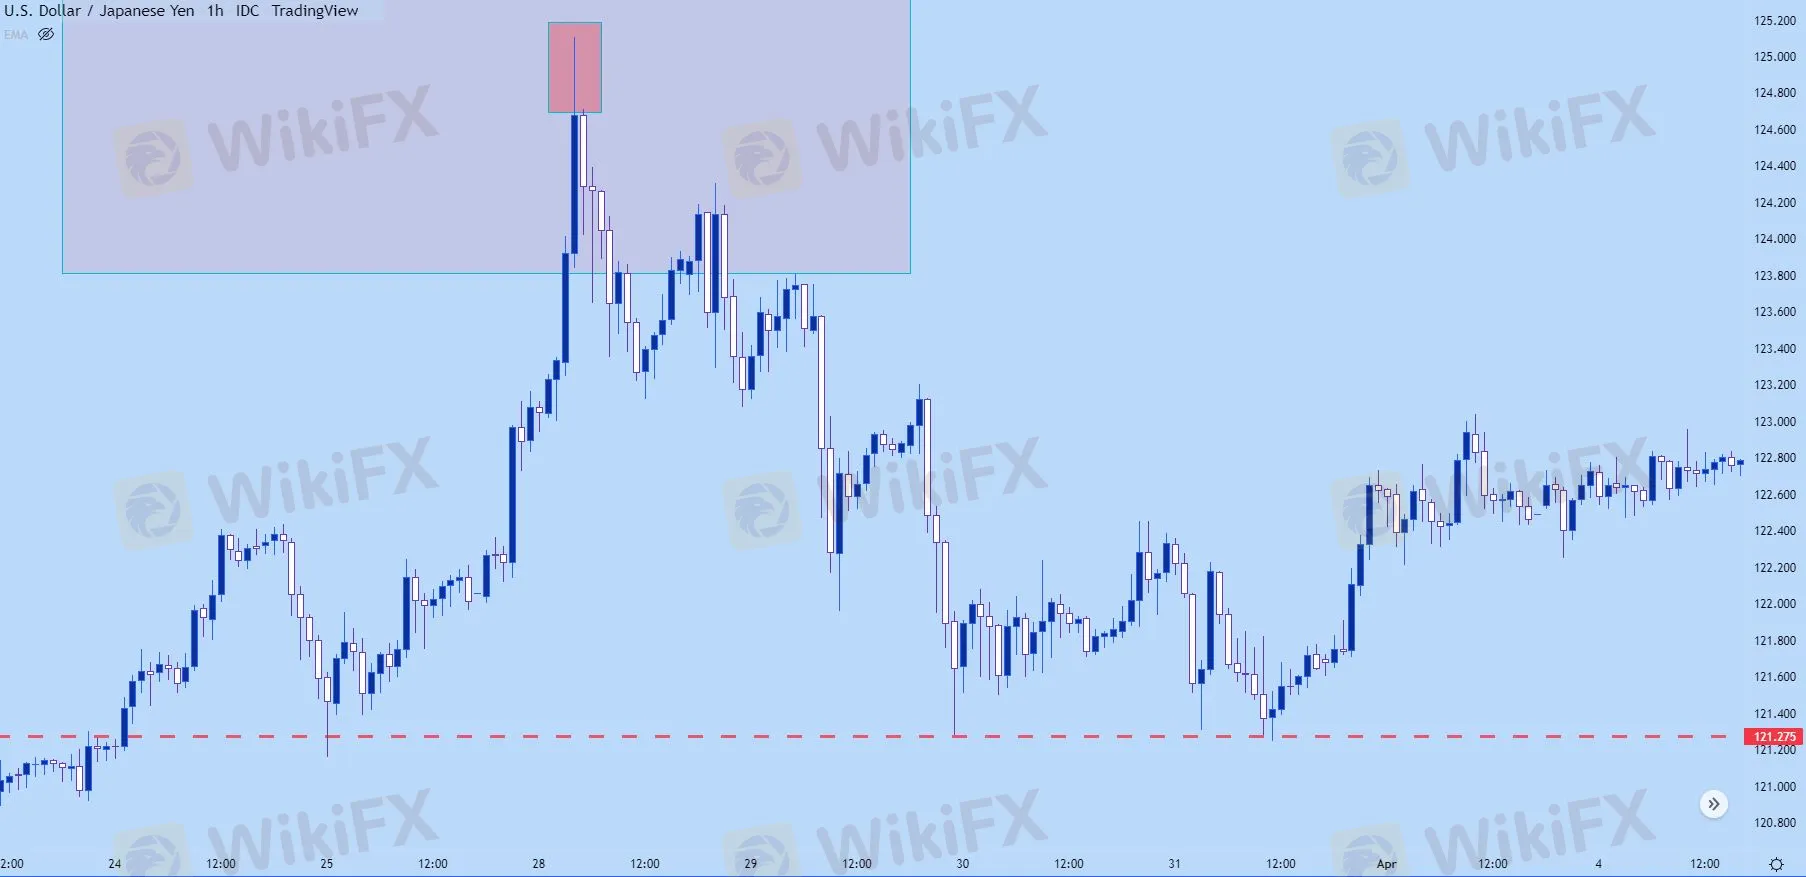
You might notice on the above chart, the red line along the bottom. Well that‘s pretty key for support and resistance identification when using price action, and we’ll dig into that in our next article on the topic.

Disclaimer:
The views in this article only represent the author's personal views, and do not constitute investment advice on this platform. This platform does not guarantee the accuracy, completeness and timeliness of the information in the article, and will not be liable for any loss caused by the use of or reliance on the information in the article.
Read more

In-Depth Uniglobe Markets Commission Fees and Spreads Analysis – What Traders Should Really Know
For experienced traders, the cost of execution is a critical factor in broker selection. Low spreads, fair commissions, and transparent pricing can be the difference between a profitable and a losing strategy over the long term. This has led many to scrutinize the offerings of brokers like Uniglobe Markets, which presents a tiered account structure promising competitive conditions. However, a professional evaluation demands more than a surface-level look at marketing claims. It requires a deep, data-driven analysis of the real trading costs, set against the backdrop of the broker's operational integrity and safety. This comprehensive Uniglobe Markets commission fees and spreads analysis will deconstruct the broker's pricing model, examining its account types, typical spreads, commission policies, and potential ancillary costs. Using data primarily sourced from the global broker inquiry platform WikiFX, we will provide a clear-eyed view of the Uniglobe Markets spreads commissions prici

In-Depth Review of Stonefort Securities Regulation and Oversight – A Trader's Guide to the Risks
For experienced traders, the process of selecting a new broker transcends a simple comparison of spreads and leverage. It is a meticulous due diligence exercise where the integrity of the broker's regulatory framework is paramount. Stonefort Securities, a relatively new entrant in the crowded brokerage space, presents a complex and often contradictory profile. On one hand, it boasts a modern MT5 platform and a stream of positive user testimonials. On the other hand, it is shadowed by severe regulatory warnings that question the very foundation of its operations. This in-depth review focuses on the core issue for any long-term trader: Stonefort Securities regulation and oversight. We will dissect the broker's corporate structure, scrutinize its licensing claims, and analyze what the data implies for trader protection and fund security. For traders evaluating whether Stonefort Securities is a trustworthy partner, understanding these details is not just important—it is essential.

FXPesa Review: Are Traders Facing High Slippage, Fund Losses & Withdrawal Denials?
Do FXPesa support officials fail to pick up your calls when you raise fund withdrawal requests with the broker? But are these officials always open to you regarding fund deposits? Do you frequently spot slippage and stop-loss order execution errors on the FXPesa login? These issues are increasingly becoming common with this forex broker. Consequently, many traders have expressed their dissatisfaction with the broker online. In this FXPesa Review article, we have shared some of these complaints. Take a look!

Trive Investigation: High Score, Hidden Risk - The Profit Paradox
A disturbing pattern has emerged regarding the broker Trive. Despite holding a high WikiFX score (7.91) and valid licenses in South Africa and Australia, recent investor reports suggest a significant disconnect between the platform's reputation and its treatment of profitable clients. While the regulatory paperwork appears in order, our data indicates that traders are facing sudden account freezes and accusations of "trading abuse" precisely when they attempt to withdraw profits. This report investigates why a seemingly "safe" broker is generating high-risk complaints.