
Globale Broker-Regulierungsanfrage-App
WikiFX
Deutsch
简体中文
繁體中文
English
Pусский
日本語
ภาษาไทย
Tiếng Việt
Bahasa Indonesia
Español
हिन्दी
Filippiiniläinen
Français
Deutsch
Português
Türkçe
한국어
العربية
FPG XAUUSD Market Report October 29, 2025
Zusammenfassung:Gold on the H4 timeframe continues to move within a bearish correction after reaching a recent peak near 4381 earlier this month. Following that top, gold prices declined sharply and found a temporary
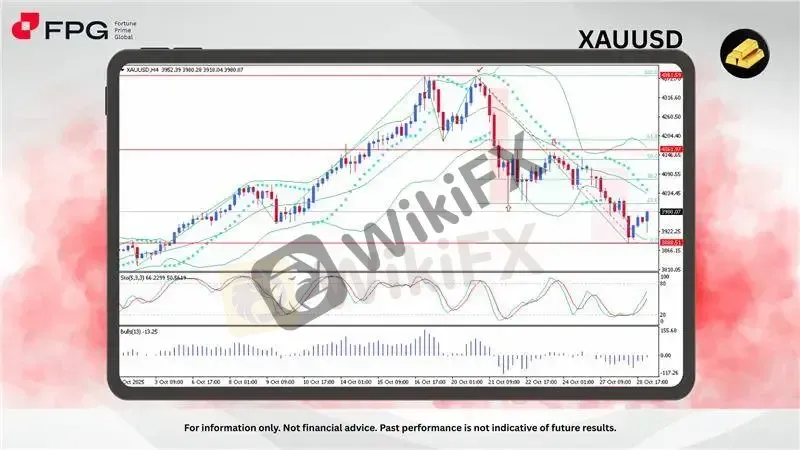
Gold on the H4 timeframe continues to move within a bearish correction after reaching a recent peak near 4381 earlier this month. Following that top, gold prices declined sharply and found a temporary floor around the 3888 support level, where the market started to stabilize. The current price hovers near 3980, showing signs of consolidation after the steep drop. While the short-term direction remains uncertain, a rebound toward the 4034–4161 resistance zone could occur if buying momentum strengthens, though the broader bias still leans bearish unless price sustains above 4161.
From a technical perspective, XAUUSD remains under the influence of a descending channel, with price action staying below both the midline and upper boundary. The Parabolic SAR continues to print above candles, confirming bearish control, while Bollinger Bands show price attempting to recover from the lower band region. The Stochastic Oscillator has turned upward from oversold territory, signaling a possible corrective rally. Meanwhile, Fibonacci retracement levels highlight key resistance below 4034 (~23.6%) and near 4161 (~50%), which could act as barriers to further recovery in the near term.
On the fundamental side, gold‘s recent weakness has been largely driven by renewed strength in the US dollar and rising Treasury yields, as market participants scale back expectations for near-term Federal Reserve rate cuts. Additionally, geopolitical risks have provided intermittent safe-haven support, limiting deeper declines. Investors remain cautious ahead of upcoming US economic data releases, which could influence expectations for future monetary policy and impact gold’s short-term trajectory.
Market Observation & Strategy Advice
1. Current Position: XAUUSD is trading around 3980, consolidating after a rebound from 3888. The pair shows early signs of stabilization but remains within a bearish structure. Buyers are cautiously testing higher levels, suggesting the possibility of a short-term corrective move if momentum continues to build.
2. Resistance Zone: The next major resistance levels are seen between 4034 – 4161, aligning with key Fibonacci retracement points and prior supply zones. A decisive break above 4161 would shift short-term sentiment toward bullish correction.
3. Support Zone: Immediate support stands at 3888 – 3865, which has proven to be a strong demand area. A close below this region may trigger renewed bearish momentum and a possible test of lower channel boundaries.
4. Indicators: The Stochastic Oscillator is recovering from oversold territory, signaling potential upward momentum, while the Parabolic SAR still indicates bearish control. Bollinger Bands show the price rebounding from the lower band, reflecting a temporary stabilization phase.
5. Trading Strategy Suggestions:
Buy on Dips: Consider buying above 3888 if the Stochastic maintains its bullish crossover, with upside targets around 4034–4161.
Sell near Resistance: Look for selling opportunities if price struggles to break above 4034–4161 or forms clear reversal patterns near that zone.
Wait for Breakout: Stay patient for confirmation, a move above 4161 may signal a stronger bullish continuation, while a drop below 3865 could trigger renewed bearish momentum.
Market Performance:
Precious Metals Last Price % Change
XPTUSD 1,576.50 +0.64%
XAGUSD 47.3404 +0.57%
Today's Key Economic Calendar:
JP: Consumer Confidence
US: MBA 30-Year Mortgage Rate
CA: BoC Interest Rate Decision
CA: BoC Monetary Policy Report
US: Pending Home Sales MoM & YoY
CA: BoC Press Conference
US: EIA Crude Oil Stocks Change
Risk Disclaimer: This report is for informational purposes only and does not constitute financial advice. Investments involve risks, and past performance does not guarantee future results. Consult your financial advisor for personalized investment strategies.
Haftungsausschluss:
Die Ansichten in diesem Artikel stellen nur die persönlichen Ansichten des Autors dar und stellen keine Anlageberatung der Plattform dar. Diese Plattform übernimmt keine Garantie für die Richtigkeit, Vollständigkeit und Aktualität der Artikelinformationen und haftet auch nicht für Verluste, die durch die Nutzung oder das Vertrauen der Artikelinformationen verursacht werden.
WikiFX-Broker
Aktuelle Nachrichten
XRP: Was Ripple dir JETZT nicht offen sagt
 WikiFX
Oracles Kurssturz ist ein weiteres Warnsignal für KI-Investoren
WikiFXSolana vor möglichem Ausbruch: ETF-Zuflüsse stützen Kurs über 131 Dollar
WikiFXCardano stabilisiert sich über 0,40 Dollar – Indikatoren nähren Hoffnungen auf Ausbruch
WikiFXWechselkursberechnung
USD

CNY
Aktueller Wechselkurs: 0
Bitte geben Sie den Betrag ein
USD
Konvertierbarer Betrag
CNY
Berechnen